Exam 10: A: Statistical Quality Control
Exam 1: Introduction to Operations Management63 Questions
Exam 2: Competitiveness, Strategic Planning, and Productivity54 Questions
Exam 3: Demand Forecasting172 Questions
Exam 4: A: Product Design74 Questions
Exam 4: B: Product Design56 Questions
Exam 5: A: Strategic Capacity Planning74 Questions
Exam 5: B: Strategic Capacity Planning64 Questions
Exam 6: A: Process Design and Facility Layout157 Questions
Exam 6: B: Process Design and Facility Layout99 Questions
Exam 7: A: Design of Work Systems143 Questions
Exam 7: B: Design of Work Systems68 Questions
Exam 8: A: Location Planning and Analysis74 Questions
Exam 8: B: Location Planning and Analysis16 Questions
Exam 9: Management of Quality98 Questions
Exam 10: A: Statistical Quality Control121 Questions
Exam 10: B: Statistical Quality Control61 Questions
Exam 11: Supply Chain Management86 Questions
Exam 12: Inventory Management168 Questions
Exam 13: Aggregate Operations Planning71 Questions
Exam 14: Material Requirements Planning and Enterprise Resource Planning84 Questions
Exam 15: A: Just-In-Time and Lean Production82 Questions
Exam 15: B: Just-In-Time and Lean Production32 Questions
Exam 16: Job and Staff Scheduling112 Questions
Exam 17: Project Management127 Questions
Exam 18: A: Waiting-Line Analysis76 Questions
Exam 18: B: Waiting-Line Analysis41 Questions
Select questions type
Which statement is an accurate description of a process that is "capable"?
Free
(Multiple Choice)
4.8/5  (37)
(37)
Correct Answer: Verified
C
What is the sample proportion of defectives for machine #1?
Free
(Multiple Choice)
4.9/5 (36)
Correct Answer:Verified
A
The amount of inspection needed is governed by the costs of inspection and the expected costs of passing defective items.
Free
(True/False)
4.9/5 (42)
Correct Answer:Verified
True
Control limits distinguish between non-random and assignable variability.
(True/False)
4.8/5 (37)
The term "2 sigma limits" in the context of a control chart refers to the variability of the:
(Multiple Choice)
4.9/5 (33)
The output of a process may not conform to design specifications even though the process may be statistically "in control".
(True/False)
4.8/5 (44)
Given the following process control data for a quality attribute (three samples of size 400 each):
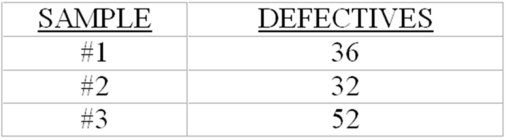 -If the process is known to produce 11 percent defectives on average,using three sigma control limits,do any of the sample proportions indicate an out-of-control process proportion of defectives?
(Short Answer)
4.8/5 (45)
A c-chart is used to monitor the number of defects per unit of a process output.
(True/False)
4.8/5 (32)
The process capability index,indicated by Cpis calculated as the ratio of the design specification width to the process width.
(True/False)
4.9/5 (35)
Control limits are statistical limits that reflect the extent to which sample statistics such as means and ranges can vary due to random variation alone.
(True/False)
4.9/5 (34)
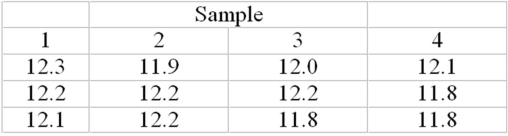
Four samples of three observations each have been taken,with actual measurements (in centimetres)shown below.Construct three sigma mean and range charts,and determine if corrective action is needed.
(Essay)
4.9/5 (34)
Assignable variation is variation due to a specific cause,such as tool wear.
(True/False)
4.8/5 (35)
Concluding that a process has changed when it has not is known as a Type I error.
(True/False)
4.9/5 (37)
The part of statistical quality control that occurs during the production process is known as acceptance sampling.
(True/False)
4.8/5 (32)
In order for a process to be capable,it must have a capability ratio of at least 1.00.
(True/False)
4.9/5 (37)
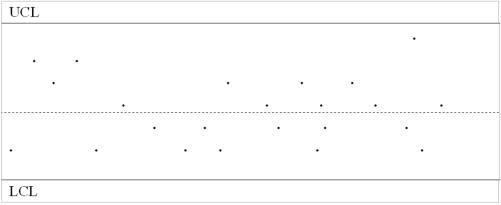
Given the following control chart,would you say that the process appears to be performing appropriately?
(Essay)
4.7/5 (34)
The process capability index,indicated by Cpkis used only when the process is centred.
(True/False)
4.8/5 (30)
Studies on a bottle-filling machine indicates it fills bottles to a mean of 16 ounces with a standard deviation of 0.10 ounces.Assuming the Cpindex = 1.0,what is/are the process specification(s)?
(Multiple Choice)
4.7/5 (33)
A sample statistic that falls inside the control limits suggests there is assignable variation in the process.
(True/False)
4.9/5 (36)
The optimum level of inspection for quality control is where the:
(Multiple Choice)
4.9/5 (38)
Filters
- Essay(0)
- Multiple Choice(0)
- Short Answer(0)
- True False(0)
- Matching(0)