Exam 14: Introduction to Linear Regression and Correlation Analysis
Exam 1: The Where,Why,and How of Data Collection167 Questions
Exam 2: Graphs,Charts and Tablesdescribing Your Data139 Questions
Exam 3: Describing Data Using Numerical Measures138 Questions
Exam 4: Introduction to Probability125 Questions
Exam 5: Discrete Probability Distributions161 Questions
Exam 6: Introduction to Continuous Probability Distributions122 Questions
Exam 7: Introduction to Sampling Distributions136 Questions
Exam 8: Estimating Single Population Parameters174 Questions
Exam 9: Introduction to Hypothesis Testing183 Questions
Exam 10: Estimation and Hypothesis Testing for Two Population Parameters121 Questions
Exam 11: Hypothesis Tests and Estimation for Population Variances69 Questions
Exam 12: Analysis of Variance162 Questions
Exam 13: Goodness-Of-Fit Tests and Contingency Analysis105 Questions
Exam 14: Introduction to Linear Regression and Correlation Analysis139 Questions
Exam 15: Multiple Regression Analysis and Model Building152 Questions
Exam 16: Analyzing and Forecasting Time-Series Data133 Questions
Exam 17: Introduction to Nonparametric Statistics103 Questions
Exam 18: Introduction to Quality and Statistical Process Control43 Questions
Select questions type
Two variables have a correlation coefficient that is very close to zero.This means that there is no relationship between the two variables.
(True/False)
4.8/5  (34)
(34)
In conducting a hypothesis test on the correlation between a pair of variables,we assume that each variable is normally and independently distributed.
(True/False)
4.8/5 (39)
The scatter plot is a two dimensional graph that is used to graphically represent the relationship between two variables.
(True/False)
4.8/5 (33)
Which of the following statements is true in simple linear regression?
(Multiple Choice)
4.8/5 (34)
If the correlation between two variables is known to be statistically significant at the 0.05 level,then the regression slope coefficient will also be significant at the 0.05 level.
(True/False)
4.8/5 (35)
If the R-square value for a simple linear regression model is .80,the correlation between the two variables is known to be .64.
(True/False)
4.9/5 (27)
A study was recently done in which the following regression output was generated using Excel.
SUMMARY OUTPUT 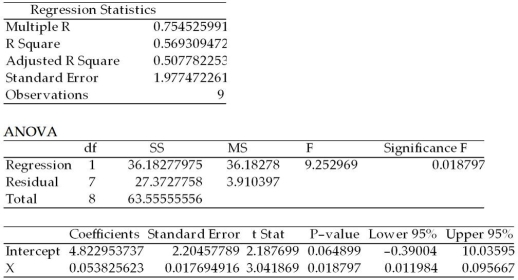 Given this output,we would reject the null hypothesis that the population regression slope coefficient is equal to zero at the alpha = 0.05 level.
(True/False)
4.8/5 (37)
A recent study by a major financial investment company was interested in determining whether the annual percentage change in stock price for companies is linearly related to the annual percent change in profits for the company.The following data was determined for 7 randomly selected companies: 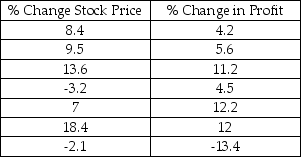 Based upon this sample information,which of the following is the regression equation?
(Multiple Choice)
4.7/5 (33)
If a simple least squares regression model is developed based on a sample where the two variables are known to be positively correlated,the sum of the residuals will be positive.
(True/False)
4.9/5 (29)
State University recently randomly sampled ten students and analyzed grade point average (GPA)and number of hours worked off-campus per week.The following data were observed:
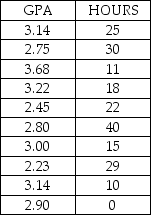 The correlation between these two variables is approximately -.461
(True/False)
4.9/5 (28)
The values of the regression coefficients are found such the sum of the residuals is minimized.
(True/False)
4.8/5 (33)
The following regression output is available.Notice that some of the values are missing. 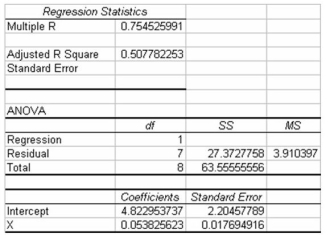 Given this information,what is the standard error of the estimate for the regression model?
(Multiple Choice)
4.9/5 (39)
A study was recently performed by the Internal Revenue Service to determine how much tip income waiters and waitresses should make based on the size of the bill at each table.A random sample of bills and resulting tips were collected and the following regression results were observed:
SUMMARY OUTPUT  Given this output,the upper limit for the 95 percent confidence interval estimate for the true regression slope coefficient is approximately 0.28.
(True/False)
4.8/5 (33)
In developing a simple linear regression model it is assumed that the distribution of error terms will be normally distributed for all levels of x.
(True/False)
4.9/5 (30)
A study was recently performed by the Internal Revenue Service to determine how much tip income waiters and waitresses should make based on the size of the bill at each table.A random sample of bills and resulting tips were collected and the following regression results were observed:
SUMMARY OUTPUT 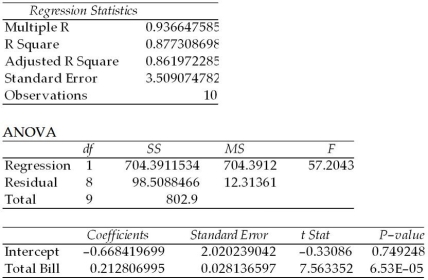 Given this output,the point estimate for the average tip per dollar amount of the bill is approximately $0.21.
(True/False)
4.8/5 (25)
In a regression analysis situation,the standard error of the slope is:
(Multiple Choice)
4.8/5 (34)
Given a regression equation of  = 16 + 2.3x we would expect that an increase in x of 2.0 would lead to an average increase of y of 4.6.
(True/False)
4.8/5 (36)
If a sample of n = 30 people is selected and the sample correlation between two variables is r = 0.468,what is the test statistic value for testing whether the true population correlation coefficient is equal to zero?
(Multiple Choice)
4.9/5 (37)
If the population correlation between two variables is determined to be -0.70,which of the following is known to be true?
(Multiple Choice)
4.8/5 (29)
If the R-squared value for a regression model is high,the regression model will necessarily provide accurate forecasts of the y variable.
(True/False)
4.8/5 (30)
Filters
- Essay(0)
- Multiple Choice(0)
- Short Answer(0)
- True False(0)
- Matching(0)