Exam 14: Introduction to Linear Regression and Correlation Analysis
Exam 1: The Where,Why,and How of Data Collection167 Questions
Exam 2: Graphs,Charts and Tablesdescribing Your Data139 Questions
Exam 3: Describing Data Using Numerical Measures138 Questions
Exam 4: Introduction to Probability125 Questions
Exam 5: Discrete Probability Distributions161 Questions
Exam 6: Introduction to Continuous Probability Distributions122 Questions
Exam 7: Introduction to Sampling Distributions136 Questions
Exam 8: Estimating Single Population Parameters174 Questions
Exam 9: Introduction to Hypothesis Testing183 Questions
Exam 10: Estimation and Hypothesis Testing for Two Population Parameters121 Questions
Exam 11: Hypothesis Tests and Estimation for Population Variances69 Questions
Exam 12: Analysis of Variance162 Questions
Exam 13: Goodness-Of-Fit Tests and Contingency Analysis105 Questions
Exam 14: Introduction to Linear Regression and Correlation Analysis139 Questions
Exam 15: Multiple Regression Analysis and Model Building152 Questions
Exam 16: Analyzing and Forecasting Time-Series Data133 Questions
Exam 17: Introduction to Nonparametric Statistics103 Questions
Exam 18: Introduction to Quality and Statistical Process Control43 Questions
Select questions type
Recently,an automobile insurance company performed a study of a random sample of 15 of its customers to determine if there is a positive relationship between the number of miles driven and the age of the driver.The sample correlation coefficient is r = .38.Given this information,and assuming that the test is to be performed at the .05 level of significance,which of the following is the correct test statistic?
(Multiple Choice)
4.7/5  (42)
(42)
A recent study of 15 shoppers showed that the correlation between the time spent in the store and the dollars spent was 0.235.Using a significance level equal to 0.05,which of the following is the test statistic for testing whether the true population correlation is equal to zero?
(Multiple Choice)
4.9/5 (24)
If a set of data contains no values of x that are equal to zero,then the regression coefficient,b0,has no particular meaning.
(True/False)
4.8/5 (28)
A study was recently conducted by Major League Baseball to determine whether there is a correlation between attendance at games and the record of home team's opponent.In this study,the dependent variable would be the record of the home team's opponent.
(True/False)
4.9/5 (48)
When using regression analysis for descriptive purposes,which of the following is of importance?
(Multiple Choice)
4.7/5 (44)
Use the following regression results to answer the question below.  How many observations were involved in this regression?
(Multiple Choice)
5.0/5 (38)
The following regression output is available.Notice that some of the values are missing. 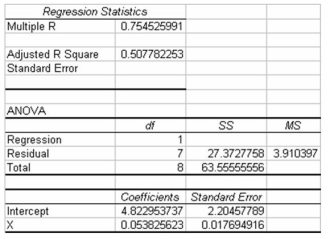 Given this information,what was the sample size used in the study?
(Multiple Choice)
4.7/5 (36)
A random sample of two variables,x and y,produced the following observations: 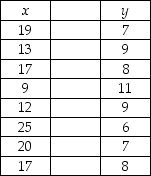 Test to determine whether the population correlation coefficient is negative.Use a significance level of 0.05 for the hypothesis test.
(Multiple Choice)
4.8/5 (40)
Explain what the correlation coefficient measures and some detail of the key issues associated with it.Be sure to also discuss the concept of spurious correlation.
(Essay)
4.9/5 (32)
Given a sample of size n = 15 and a sample correlation of r = 0.7,the value of the test statistic for conducting a hypothesis test of the correlation is t = 3.53.
(True/False)
4.9/5 (42)
The difference between a scatter plot and a scatter diagram is that the scatter plot has the independent variable on the x-axis while the independent variable is on the Y-axis in a scatter diagram.
(True/False)
4.8/5 (31)
If the correlation coefficient for two variables is computed to be a -0.70,the scatter plot will show the data to be downward sloping from left to right.
(True/False)
4.9/5 (37)
Use the following regression results to answer the question below. 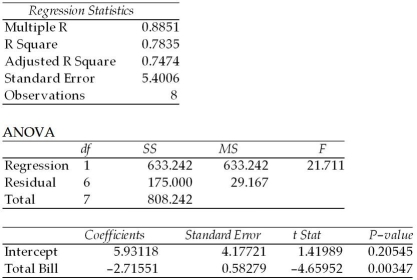 Which of the following is true?
(Multiple Choice)
4.8/5 (43)
A recent study of 15 shoppers showed that the correlation between the time spent in the store and the dollars spent was 0.235.Using a significance level equal to 0.05,which of the following is the appropriate null hypothesis to test whether the population correlation is zero?
(Multiple Choice)
4.9/5 (34)
In a university statistics course a correlation of -0.8 was found between numbers of classes missed and course grade.This means that the fewer classes students missed,the higher the grade.
(True/False)
4.9/5 (32)
If the correlation of x and y is -0.65,then coefficient of determination is -0.4225.
(True/False)
4.8/5 (40)
In simple linear regression,the t-test for the slope and the F-test are both conducting the same hypothesis test.
(True/False)
4.9/5 (37)
Filters
- Essay(0)
- Multiple Choice(0)
- Short Answer(0)
- True False(0)
- Matching(0)