Exam 14: Introduction to Linear Regression and Correlation Analysis
Exam 1: The Where,Why,and How of Data Collection167 Questions
Exam 2: Graphs,Charts and Tablesdescribing Your Data139 Questions
Exam 3: Describing Data Using Numerical Measures138 Questions
Exam 4: Introduction to Probability125 Questions
Exam 5: Discrete Probability Distributions161 Questions
Exam 6: Introduction to Continuous Probability Distributions122 Questions
Exam 7: Introduction to Sampling Distributions136 Questions
Exam 8: Estimating Single Population Parameters174 Questions
Exam 9: Introduction to Hypothesis Testing183 Questions
Exam 10: Estimation and Hypothesis Testing for Two Population Parameters121 Questions
Exam 11: Hypothesis Tests and Estimation for Population Variances69 Questions
Exam 12: Analysis of Variance162 Questions
Exam 13: Goodness-Of-Fit Tests and Contingency Analysis105 Questions
Exam 14: Introduction to Linear Regression and Correlation Analysis139 Questions
Exam 15: Multiple Regression Analysis and Model Building152 Questions
Exam 16: Analyzing and Forecasting Time-Series Data133 Questions
Exam 17: Introduction to Nonparametric Statistics103 Questions
Exam 18: Introduction to Quality and Statistical Process Control43 Questions
Select questions type
In a simple regression model,if the regression model is deemed to be statistically significant,it means that the regression slope coefficient is significantly greater than zero.
(True/False)
4.8/5  (26)
(26)
A cellular phone service provider believes that there is negative correlation between the minutes used by its customers and the age of the customer.To test this,the following would be the appropriate null and alternative hypotheses:
H0 : ρ = 0.0
Ha : ρ ≠ 0.0
(True/False)
4.8/5 (32)
The standard error of the estimate for a simple linear regression model measures the variation in the slope coefficient from sample to sample.
(True/False)
4.9/5 (27)
If the sample value of the intercept turns out to be an illogical value,this is acceptable as long as x = 0 is not within the range of the data.
(True/False)
4.7/5 (28)
You are given the following sample data for two variables:
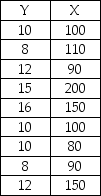 The sample correlation coefficient for these data is approximately r = 0.755.
(True/False)
4.7/5 (38)
A national job placement company is interested in developing a model that might be used to explain the variation in starting salaries for college graduates based on the college GPA.The following data were collected through a random sample of the clients with which this company has been associated.
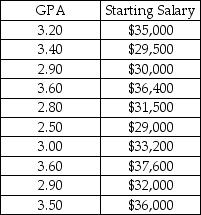 Based on this sample information,determine the least squares regression model,determine what percent of the variation in starting salaries is explained by GPA,and test to determine whether the regression model is statistically significant at the 0.05 level of significance.Also,develop a scatter plot of the data and locate the regression line on the scatter plot.
(Essay)
4.8/5 (35)
An industry study was recently conducted in which the sample correlation between units sold and marketing expenses was 0.57.The sample size for the study included 15 companies.Based on the sample results,test to determine whether there is a significant positive correlation between these two variables.Use an alpha = 0.05
(Multiple Choice)
4.9/5 (25)
State University recently randomly sampled ten students and analyzed grade point average (GPA)and number of hours worked off-campus per week.The following data were observed:
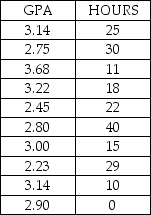 The test statistic for testing whether the two variables are significantly correlated is approximately z = 1.56.
(True/False)
4.8/5 (33)
If you were going to develop a scatter plot for the purpose of determining whether one of the assumptions of the regression model is being satisfied,which of the following is true?
(Multiple Choice)
4.7/5 (37)
If the correlation between the dependent variable and the independent variable is negative,the standard error of the regression slope coefficient in a simple linear regression model will also be negative.
(True/False)
4.8/5 (35)
The Public Utility Commission in a southern state is interested in describing the relationship between household monthly utility bills and the size of the house.A recent study of 30 randomly selected household resulted in the following regression results: 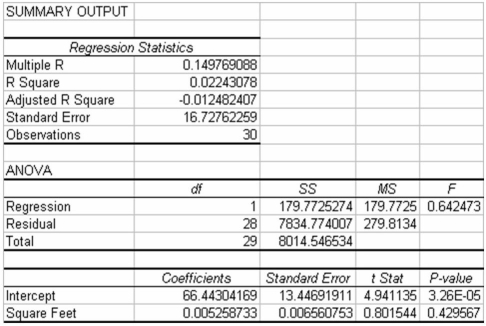 Based on the information provided,indicate what,if any,conclusions can be reached about the relationship between utility bill and the size of the house in square feet.
(Essay)
4.9/5 (35)
Given a sample of data for use in simple linear regression,the values for the slope and the intercept are chosen to minimize the sum of squared errors.
(True/False)
4.7/5 (31)
A positive population slope of 12 (β1 = 12)means that a 1-unit increase in x causes an average 12-unit increase in y.
(True/False)
4.8/5 (25)
The National Football League has performed a study in which the total yards gained by teams in games was used as an independent variable to explain the variation in total points scored by teams during games.The points scored ranged from 0 to 57 and the yards gained ranged from 187 to 569.The following regression model was determined:  = 12.3 + .12x Given this model,which of the following statements is true?
(Multiple Choice)
4.9/5 (39)
The term that is given when two variables are correlated but there is no apparent connection between them is:
(Multiple Choice)
4.9/5 (48)
Consider the following partially completed computer printout for a regression analysis where the dependent variable is the price of a personal computer and the independent variable is the size of the hard drive. 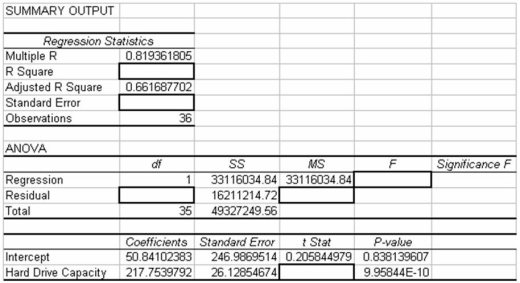 Based on the information provided,what percentage of the variation in the price of the personal computers is accounted for by the regression model using hard drive capacity as the independent variable?
(Multiple Choice)
4.8/5 (31)
Given a sample correlation r = -0.5 and a sample size of n = 30,the test statistic for testing whether the two variables are significantly correlated is approximately t = -3.055.
(True/False)
4.9/5 (43)
Use the following regression results to answer the question below. 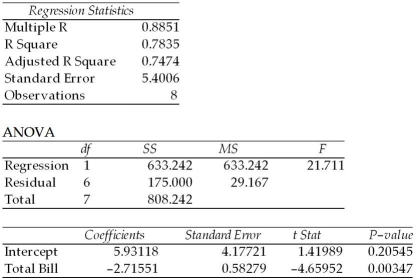 Which of the following is true?
(Multiple Choice)
4.9/5 (34)
A scatter plot is useful for identifying a linear relationship between the independent and dependent variable,but it is not particularly useful if the relationship is curvilinear.
(True/False)
4.8/5 (37)
Assume that we have found a regression equation of  = 3.6 - 2.4x,and that the coefficient of determination is 0.72,then the correlation of x and y must be about 0.849.
(True/False)
4.8/5 (27)
Filters
- Essay(0)
- Multiple Choice(0)
- Short Answer(0)
- True False(0)
- Matching(0)