Exam 14: Introduction to Linear Regression and Correlation Analysis
Exam 1: The Where,Why,and How of Data Collection167 Questions
Exam 2: Graphs,Charts and Tablesdescribing Your Data139 Questions
Exam 3: Describing Data Using Numerical Measures138 Questions
Exam 4: Introduction to Probability125 Questions
Exam 5: Discrete Probability Distributions161 Questions
Exam 6: Introduction to Continuous Probability Distributions122 Questions
Exam 7: Introduction to Sampling Distributions136 Questions
Exam 8: Estimating Single Population Parameters174 Questions
Exam 9: Introduction to Hypothesis Testing183 Questions
Exam 10: Estimation and Hypothesis Testing for Two Population Parameters121 Questions
Exam 11: Hypothesis Tests and Estimation for Population Variances69 Questions
Exam 12: Analysis of Variance162 Questions
Exam 13: Goodness-Of-Fit Tests and Contingency Analysis105 Questions
Exam 14: Introduction to Linear Regression and Correlation Analysis139 Questions
Exam 15: Multiple Regression Analysis and Model Building152 Questions
Exam 16: Analyzing and Forecasting Time-Series Data133 Questions
Exam 17: Introduction to Nonparametric Statistics103 Questions
Exam 18: Introduction to Quality and Statistical Process Control43 Questions
Select questions type
When the intercept in a regression equation is deemed not significantly different from 0,then in making predictions for y,0.0 should be used as the value of the intercept rather than the estimated intercept value.
(True/False)
5.0/5  (33)
(33)
Which of the following is NOT an assumption for the simple linear regression model?
(Multiple Choice)
4.7/5 (23)
When regression analysis is used for descriptive purposes,two of the main items of interest are whether the sign on the regression slope coefficient is positive or negative and whether the regression slope coefficient is significantly different from zero.
(True/False)
4.7/5 (25)
When a correlation is found between a pair of variables,this always means that there is a direct cause and effect relationship between the variables.
(True/False)
4.8/5 (24)
The following regression output was generated based on a sample of utility customers.The dependent variable was the dollar amount of the monthly bill and the independent variable was the size of the house in square feet. 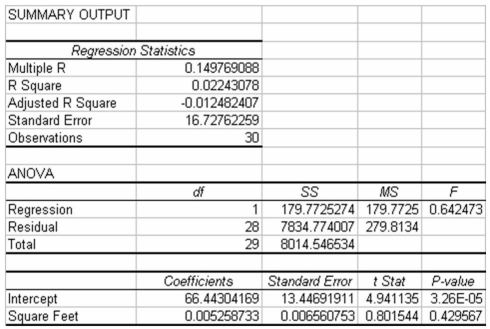 Based on this regression output,what is the 95 percent confidence interval estimate for the population regression slope coefficient?
(Multiple Choice)
4.8/5 (32)
Consider the following partially completed computer printout for a regression analysis where the dependent variable is the price of a personal computer and the independent variable is the size of the hard drive. 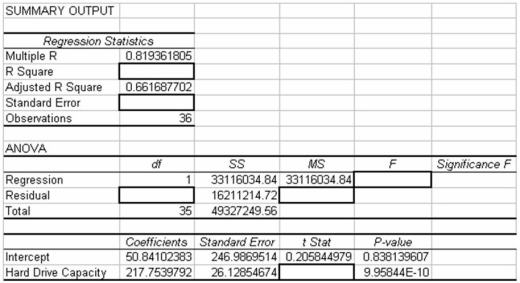 Based on the information provided,which of the following statements is true if alpha = .05?
(Multiple Choice)
4.8/5 (34)
A study was recently performed by the Internal Revenue Service to determine how much tip income waiters and waitresses should make based on the size of the bill at each table.A random sample of bills and resulting tips were collected.These data are shown as follows: 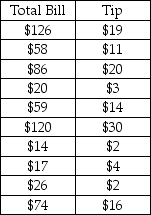 Based upon these data,what is the approximate predicted value for tips if the total bill is $100?
(Multiple Choice)
4.9/5 (29)
Which of the following is a correct interpretation for the regression slope coefficient?
(Multiple Choice)
4.9/5 (28)
Given the data below,one ran the simple regression analysis of Y on X. 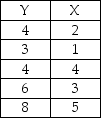 The relationship between Y and X is
(Multiple Choice)
4.7/5 (36)
In a study of 30 customers' utility bills in which the monthly bill was the dependent variable and the number of square feet in the house is the independent variable,the resulting regression model is  = 23.40 + 0.04x.Given this model,for a customer with a 2,000 square foot house and a monthly utility bill equal to $100.00,the residual from the regression model is approximately -$3.40.
(True/False)
4.8/5 (33)
A high coefficient of determination (R2)implies that the regression model will be a good predictor for future values of the dependent variable given the value of the independent variable.
(True/False)
4.8/5 (38)
Recently,an automobile insurance company performed a study of a random sample of 15 of its customers to determine if there is a positive relationship between the number of miles driven and the age of the driver.The sample correlation coefficient is r = .38.Given this information,which of the following is appropriate critical value for testing the null hypothesis at an alpha = .05 level?
(Multiple Choice)
4.9/5 (41)
If two variables are related in a positive linear manner,the scatter plot will show points on the x,y space that are generally moving from the lower left to the upper right.
(True/False)
4.7/5 (31)
A correlation coefficient computed from a sample of data values selected from a population is called a statistic and is subject to sampling error.
(True/False)
4.8/5 (39)
If a residual plot exhibits a curved pattern in the residuals,this means that:
(Multiple Choice)
4.8/5 (39)
The sign on the intercept coefficient in a simple regression model will always be the same as the sign on the correlation coefficient.
(True/False)
4.8/5 (29)
When the correlation coefficient for the two variables was -0.23,it implies that the two variables are not correlated because the correlation coefficient cannot be negative.
(True/False)
4.8/5 (35)
Explain why it is important to construct scatter plots prior to conducting regression analysis.
(Essay)
4.9/5 (31)
Which of the following statements is true with respect to a simple linear regression model?
(Multiple Choice)
4.8/5 (32)
What factors are of importance to an analyst when linear regression analysis is used for descriptive purposes?
(Essay)
4.8/5 (37)
Filters
- Essay(0)
- Multiple Choice(0)
- Short Answer(0)
- True False(0)
- Matching(0)