Exam 14: Introduction to Linear Regression and Correlation Analysis
Exam 1: The Where,Why,and How of Data Collection167 Questions
Exam 2: Graphs,Charts and Tablesdescribing Your Data139 Questions
Exam 3: Describing Data Using Numerical Measures138 Questions
Exam 4: Introduction to Probability125 Questions
Exam 5: Discrete Probability Distributions161 Questions
Exam 6: Introduction to Continuous Probability Distributions122 Questions
Exam 7: Introduction to Sampling Distributions136 Questions
Exam 8: Estimating Single Population Parameters174 Questions
Exam 9: Introduction to Hypothesis Testing183 Questions
Exam 10: Estimation and Hypothesis Testing for Two Population Parameters121 Questions
Exam 11: Hypothesis Tests and Estimation for Population Variances69 Questions
Exam 12: Analysis of Variance162 Questions
Exam 13: Goodness-Of-Fit Tests and Contingency Analysis105 Questions
Exam 14: Introduction to Linear Regression and Correlation Analysis139 Questions
Exam 15: Multiple Regression Analysis and Model Building152 Questions
Exam 16: Analyzing and Forecasting Time-Series Data133 Questions
Exam 17: Introduction to Nonparametric Statistics103 Questions
Exam 18: Introduction to Quality and Statistical Process Control43 Questions
Select questions type
A random sample of two variables,x and y,produced the following observations: 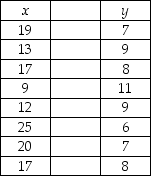 Compute the correlation coefficient for these sample data.
(Multiple Choice)
4.8/5  (38)
(38)
Assume that you have calculated a prediction of  = 110 where the specific value for x is equal to the average value of x.Also assume that n = 201 and that the standard error of the estimate is sε = 4.5.Find the approximate 95 percent prediction interval.
(Multiple Choice)
4.8/5 (40)
When constructing a scatter plot,the dependent variable is placed on the vertical axis and the independent variable is placed on the horizontal axis.
(True/False)
4.8/5 (35)
Given the following regression equation,the predicted value for y when x = 0.5 is about 4.57 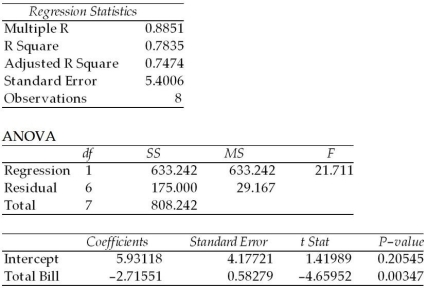
(True/False)
4.9/5 (38)
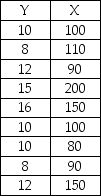
A study was done in which the high daily temperature and the number of traffic accidents within the city were recorded.These sample data are shown as follows: 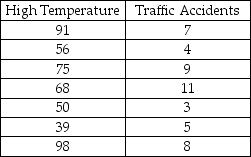 Given this data the sample correlation is:
(Multiple Choice)
4.8/5 (36)
Both a scatter plot and the correlation coefficient can distinguish between a curvilinear and a linear relationship.
(True/False)
4.8/5 (43)
In a study of 30 customers' utility bills in which the monthly bill was the dependent variable and the number of square feet in the house is the independent variable,the resulting regression model is  = 23.40 + 0.4x.Based on this model,the expected utility bill for a customer with a home with 2,300 square feet is approximately $92.00.
(True/False)
4.7/5 (24)
State University recently randomly sampled seven students and analyzed grade point average (GPA)and number of hours worked off-campus per week.The following data were observed:
 In testing the significance of the regression slope coefficient for the independent variable,HOURS,the calculated test statistic is approximately t = -1.47.
(True/False)
4.7/5 (34)
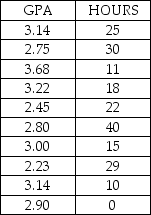
State University recently randomly sampled ten students and analyzed grade point average (GPA)and number of hours worked off-campus per week.The following data were observed:
 If the university wished to test the claim that the correlation between hours worked and GPA is negative,the following null and alternative hypotheses would be appropriate:
H0 : ρ < 0.0
Ha : ρ ≥ 0.0
If the university wished to test the claim that the correlation between hours worked and GPA is negative,the following null and alternative hypotheses would be appropriate:
H0 : ρ < 0.0
Ha : ρ ≥ 0.0
(True/False)
4.9/5 (36)
The following regression output is available.Notice that some of the values are missing. 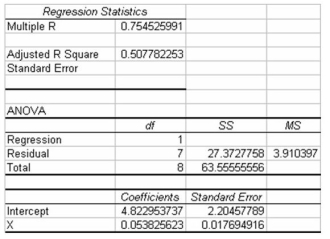 Given this information,what is the test statistic for testing whether the regression slope coefficient is equal to zero?
(Multiple Choice)
4.7/5 (37)
If two variables are spuriously correlated,it means that the correlation coefficient between them is near zero.
(True/False)
4.8/5 (36)
A dependent variable is the variable that we wish to predict or explain in a regression model.
(True/False)
4.9/5 (33)
Assume that a medical research study found a correlation of -0.73 between consumption of vitamin A and the cancer rate of a particular type of cancer.This could be interpreted to mean:
(Multiple Choice)
5.0/5 (42)
If a pair of variables have a strong curvilinear relationship,which of the following is true?
(Multiple Choice)
4.9/5 (39)
In analyzing the relationship between two variables,a scatter plot can be used to detect which of the following?
(Multiple Choice)
5.0/5 (37)
You are given the following sample data for two variables:
 Based upon these sample data,and testing at the 0.05 level of significance,the critical value for testing whether the population correlation coefficient is equal to zero is t = 2.2622.
(True/False)
4.9/5 (27)
State University recently randomly sampled seven students and analyzed grade point average (GPA)and number of hours worked off-campus per week.The following data were observed:
 A regression model with HOURS as the independent variable has an R-square equal to approximately .46.
(True/False)
4.8/5 (44)
The following regression model has been computed based on a sample of twenty observations:  = 34.2 + 19.3x.The first observations in the sample for y and x were 300 and 18,respectively.Given this,the residual value for the first observation is approximately 81.6.
(True/False)
4.9/5 (32)
If a simple least squares regression model is developed based on a sample where the two variables are known to be positively correlated,the sign on the regression coefficient will be positive also.
(True/False)
4.9/5 (35)
Filters
- Essay(0)
- Multiple Choice(0)
- Short Answer(0)
- True False(0)
- Matching(0)