Exam 19: Nonparametric Statistics
Exam 1: What Is Statistics46 Questions
Exam 2: Graphical Descriptive Techniques 194 Questions
Exam 3: Graphical Descriptive Techniques 2156 Questions
Exam 4: Numerical Descriptive Techniques275 Questions
Exam 5: Data Collection and Sampling84 Questions
Exam 6: Probability240 Questions
Exam 7: Random Variables and Discrete Probability Distributions283 Questions
Exam 8: Continuous Probability Distributions224 Questions
Exam 9: Sampling Distributions156 Questions
Exam 10: Introduction to Estimation154 Questions
Exam 11: Introduction to Hypothesis Testing189 Questions
Exam 12: Inference About a Population153 Questions
Exam 13: Inference About Comparing Two Populations170 Questions
Exam 14: Analysis of Variance157 Questions
Exam 15: Chi-Squared Tests179 Questions
Exam 16: Simple Linear Regression and Correlation304 Questions
Exam 17: Multiple Regression160 Questions
Exam 18: Model Building148 Questions
Exam 19: Nonparametric Statistics175 Questions
Exam 20: Time-Series Analytics and Forecasting225 Questions
Exam 21: Statistical Process Control140 Questions
Exam 22: Decision Analysis123 Questions
Exam 23: Conclusion47 Questions
Select questions type
Advertisement
In a Kruskal-Wallis test to determine whether differences exist among three different advertisements,the following statistics were obtained: T1 = 884,n1 = 20,T2 = 756,n2 = 28,T3 = 1061,n3 = 25.
-{Advertisement Narrative} Explain how to use the p-value for testing the hypotheses.
(Essay)
4.8/5  (48)
(48)
Keyboard Speed
Ten administration assistants were selected at random from a large university.The keyboard speed (number of words per minute)was recorded for each secretary on two different brands of computer keyboards.Assume that the typing speeds are not normally distributed.The following results were obtained. 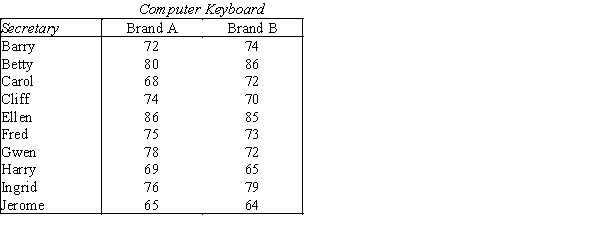
-{Keyboard Speed Narrative} Perform the sign test to determine if these data provide enough evidence at the 5% significance level to infer that the brands differ with respect to keyboard speed.
-{Keyboard Speed Narrative} Perform the sign test to determine if these data provide enough evidence at the 5% significance level to infer that the brands differ with respect to keyboard speed.
(Essay)
4.7/5 (34)
Assessments of TV Shows
Because of the cost of producing television shows and the profits associated with successful shows,television network executives are keenly interested in public opinion.A network has recently developed three comedy series.The pilot of each series is shown in to 10 randomly selected people who evaluate each show on a 9-point scale where 1 = terrible and 9 = excellent.The results are shown below. 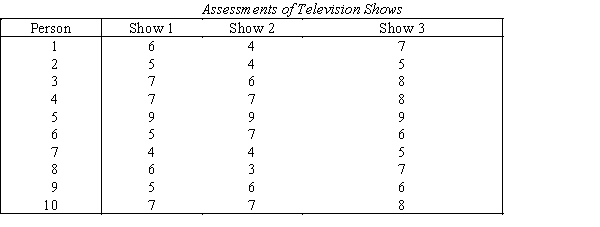
-{Assessments of TV Shows Narrative} Which statistical technique is appropriate if the television network executives want to compare the three comedy shows?
-{Assessments of TV Shows Narrative} Which statistical technique is appropriate if the television network executives want to compare the three comedy shows?
(Short Answer)
4.9/5 (33)
Movie Scripts
In general,before a producer agrees to make a movie,each script is thoroughly reviewed by movie editors.Suppose that the Big-Screen Film Company has recently received two scripts for new movies.To help them decide which one to produce,both are sent to 30 editors who rate the scripts to judge which one is better.Suppose that 10 editors rate script 1 better and 20 rate script 2 better.
-{Movie Scripts Narrative} Can Big-Screen conclude at the 5% significance level that script 2 is more highly rated than script 1?
(Essay)
4.8/5 (28)
Which of the following shows the calculation of the sample Spearman rank coefficient?
(Multiple Choice)
4.8/5 (37)
The Kruskal-Wallis test can be used to determine whether a difference exists between two populations.However,to determine whether one population location is larger than another,we must apply the Wilcoxon rank sum test.
(True/False)
4.8/5 (37)
Advertisement
In a Kruskal-Wallis test to determine whether differences exist among three different advertisements,the following statistics were obtained: T1 = 884,n1 = 20,T2 = 756,n2 = 28,T3 = 1061,n3 = 25.
-{Advertisement Narrative} What is the most accurate statement that can be made about the p-value of this test?
(Short Answer)
4.8/5 (37)
Airlines Ranking
Ten business people who fly frequently from Las Vegas to Miami were asked to rank four airlines in terms of the quality of service.The people assigned scores using a 5-point Likert scale where: 1 = bad,2 = poor,3 = average,4 = good,and 5 = excellent.The results are shown below: 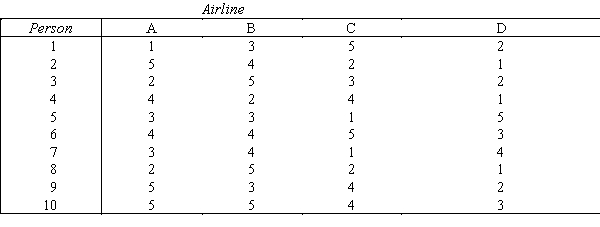
-{Airlines Ranking Narrative} Can we conclude at the 5% significance level that there are differences in service quality among the four airlines?
-{Airlines Ranking Narrative} Can we conclude at the 5% significance level that there are differences in service quality among the four airlines?
(Essay)
4.8/5 (46)
The alternative hypothesis of the Friedman test is that ____________________ population locations differ.
(Short Answer)
4.9/5 (37)
The Spearman rank correlation coefficient is equal to the ____________________ correlation coefficient of the ranks of the data.
(Short Answer)
5.0/5 (39)
Nonparametric methods are designed to test ____________________ data.
(Short Answer)
4.7/5 (38)
When the Kruskal-Wallis test is used to test for a difference between two populations,it will produce the same outcome as the two-tail Wilcoxon ____________________ test.
(Short Answer)
4.9/5 (49)
A one-sample t-test is the parametric counterpart of the Friedman test for randomized block experimental design.
(True/False)
4.9/5 (39)
To apply the Friedman test to determine whether the locations of two or more populations are the same,the samples must be:
(Multiple Choice)
4.8/5 (36)
In testing H0: ρs = 0 vs.H1: ρs≠ 0 when the sample size n > 30,the test statistic is approximately normally distributed with mean 0 and standard deviation equal to:
(Multiple Choice)
4.9/5 (41)
Some statistical software perform the Mann-Whitney test.However,this test and the sign test are equivalent tests.
(True/False)
4.9/5 (38)
The Kruskal-Wallis test compares the locations of ____________________ populations.
(Short Answer)
5.0/5 (34)
Nonparametric procedures are often called ____________________-free statistics.
(Short Answer)
4.7/5 (40)
Each year the human resources department in a large corporation assesses the performance of all of its employees.Each employee is rated for various aspects of his or her job on a 7-point scale where 1 = very unsatisfactory and 7 = satisfactory.The CEO of the company believes that the assessment scores this year are lower than last year's.To examine the validity of this belief she draws a random sample of six employees' scores from last year and another six employees' scores this year.Do the data listed below allow the CEO to conclude at the 5% significance level that her belief is correct? 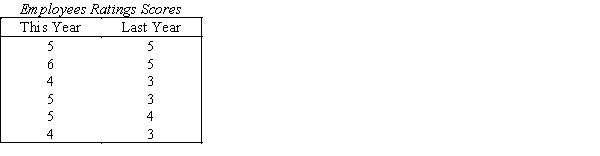
(Essay)
4.8/5 (28)
Filters
- Essay(0)
- Multiple Choice(0)
- Short Answer(0)
- True False(0)
- Matching(0)