Exam 21: Statistical Process Control
Exam 1: What Is Statistics46 Questions
Exam 2: Graphical Descriptive Techniques 194 Questions
Exam 3: Graphical Descriptive Techniques 2156 Questions
Exam 4: Numerical Descriptive Techniques275 Questions
Exam 5: Data Collection and Sampling84 Questions
Exam 6: Probability240 Questions
Exam 7: Random Variables and Discrete Probability Distributions283 Questions
Exam 8: Continuous Probability Distributions224 Questions
Exam 9: Sampling Distributions156 Questions
Exam 10: Introduction to Estimation154 Questions
Exam 11: Introduction to Hypothesis Testing189 Questions
Exam 12: Inference About a Population153 Questions
Exam 13: Inference About Comparing Two Populations170 Questions
Exam 14: Analysis of Variance157 Questions
Exam 15: Chi-Squared Tests179 Questions
Exam 16: Simple Linear Regression and Correlation304 Questions
Exam 17: Multiple Regression160 Questions
Exam 18: Model Building148 Questions
Exam 19: Nonparametric Statistics175 Questions
Exam 20: Time-Series Analytics and Forecasting225 Questions
Exam 21: Statistical Process Control140 Questions
Exam 22: Decision Analysis123 Questions
Exam 23: Conclusion47 Questions
Select questions type
In order to test if a production process is under control,30 samples of 1,000 units were drawn and the number of defectives in each sample was determined.The mean sample proportion was found to be .0615.Compute the centerline and control limits for the p chart.
(Essay)
4.9/5  (35)
(35)
You stopped a production process because you felt the process was out of control according to your control chart.However,it turns out the process was in control,costing you $20,000 in downtime of the equipment and laborers.This is an example of a costly Type____________ error.
(Short Answer)
4.7/5 (27)
40 Samples Manufacturing
The mean of the sample means and the pooled standard deviation of 40 samples of size 5 taken from a production process under control are  ,and S = 11.5,respectively.
-{40 Samples Manufacturing Narrative} Suppose you take a sample of size 5 and find the mean to be 502.80.What do you conclude?
,and S = 11.5,respectively.
-{40 Samples Manufacturing Narrative} Suppose you take a sample of size 5 and find the mean to be 502.80.What do you conclude?
(Essay)
4.8/5 (36)
What are the null and alternative hypotheses used to determine whether or not a process is in control?
(Essay)
4.7/5 (37)
If the upper and lower specification limits of a process are .852 and .828,respectively,and the process standard deviation is .002,then the process capability index Cp is
(Multiple Choice)
4.8/5 (28)
Discuss what we mean by chance variation in a process and give an example.
(Essay)
4.9/5 (30)
The average run length indicates how often a false alarm is expected to occur.That is,the average run length is one divided by the probability of a Type ____________________ error.
(Short Answer)
4.8/5 (35)
When estimating the population standard deviation,you typically use the sample standard deviations.However,for a variety of reasons,statistical process control frequently uses the ____________________ instead of the standard deviation.
(Short Answer)
4.8/5 (32)
Variations in a process that are caused by a number of randomly occurring events that cannot be eliminated without changing the process are known as:
(Multiple Choice)
5.0/5 (32)
The lower and upper control limits for the p chart are based on the standard deviation of the process.
(True/False)
4.9/5 (43)
If the average run length of a process is 385,that means the sample size should be 385 for each sample collected.
(True/False)
4.8/5 (30)
To estimate the standard deviation of a process distribution,we calculate the sample variance for each sample collected.Then we compute the ____________________ standard deviation,denoted by S.
(Short Answer)
4.9/5 (37)
____________________ is the term used when the standard deviation of a process distribution increases.
(Short Answer)
4.9/5 (33)
When the purpose of sampling is to detect when a process becomes too variable,the chart of choice will be a p chart.
(True/False)
4.8/5 (36)
The process capability index is defined as Cp = (USL − LSL)/ 6,where USL and LSL are the upper and lower specification limits.
(True/False)
4.8/5 (29)
When the  control chart shows an increase in the standard deviation of the process,the result is referred to as:
(Multiple Choice)
4.7/5 (39)
The lower control limit for the  ,p,and R charts must be zero or above.
(True/False)
4.8/5 (43)
A coffee machine fills cups with an average of 6 ounces with a standard deviation of .25 ounces.A sample of 9 cups is taken.The lower and upper control limits for a 3-sigma  control chart are 5.75 and 6.25,respectively.
(True/False)
4.8/5 (38)
Diaper Delivery
Wrap-M-Up,a Ft.Lauderdale diaper Service,has 10 delivery men who each deliver diapers to 50 customers every day.Wrap-M-Up decides to record the proportion of diapers delivered on time for a 10-day period and construct a p chart to see whether the proportion is too erratic.The data are shown below: 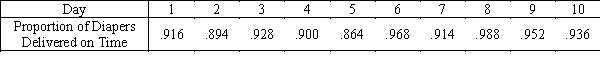
-{Diaper Delivery Narrative} At which days is the process out of control?
-{Diaper Delivery Narrative} At which days is the process out of control?
(Short Answer)
4.7/5 (35)
Assembly Line
Random samples of 200 parts were taken on an assembly line every hour for the past 25 hours.The number of defective parts is shown in the accompanying table. 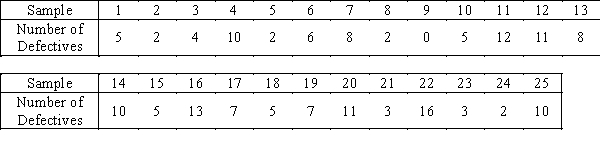
-{Assembly Line Narrative} Apply the pattern tests to determine if the production process is under control.
-{Assembly Line Narrative} Apply the pattern tests to determine if the production process is under control.
(Essay)
4.8/5 (27)
Filters
- Essay(0)
- Multiple Choice(0)
- Short Answer(0)
- True False(0)
- Matching(0)