Exam 21: Statistical Process Control
Exam 1: What Is Statistics46 Questions
Exam 2: Graphical Descriptive Techniques 194 Questions
Exam 3: Graphical Descriptive Techniques 2156 Questions
Exam 4: Numerical Descriptive Techniques275 Questions
Exam 5: Data Collection and Sampling84 Questions
Exam 6: Probability240 Questions
Exam 7: Random Variables and Discrete Probability Distributions283 Questions
Exam 8: Continuous Probability Distributions224 Questions
Exam 9: Sampling Distributions156 Questions
Exam 10: Introduction to Estimation154 Questions
Exam 11: Introduction to Hypothesis Testing189 Questions
Exam 12: Inference About a Population153 Questions
Exam 13: Inference About Comparing Two Populations170 Questions
Exam 14: Analysis of Variance157 Questions
Exam 15: Chi-Squared Tests179 Questions
Exam 16: Simple Linear Regression and Correlation304 Questions
Exam 17: Multiple Regression160 Questions
Exam 18: Model Building148 Questions
Exam 19: Nonparametric Statistics175 Questions
Exam 20: Time-Series Analytics and Forecasting225 Questions
Exam 21: Statistical Process Control140 Questions
Exam 22: Decision Analysis123 Questions
Exam 23: Conclusion47 Questions
Select questions type
A malfunction in the process goes unnoticed and later causes great expense in terms of operator and machine downtime.What type of error was caused here and how could it be decreased?
(Essay)
4.8/5  (36)
(36)
If your control chart found a series of points all lying within 3 standard errors above the center line,and none lying below the centerline,this could be an indication of assignable variation due to a(n)____________________.
(Short Answer)
4.8/5 (32)
If the control limits of an  chart are set at ±2 standard errors from the centerline instead of the commonly used ±3 standard errors,this will result in
(Multiple Choice)
4.8/5 (30)
The mean of the sample means and the pooled standard deviation of 25 samples of size 4 taken from a production process under control are found to be 150 and 10,respectively.The centerline for the  chart is:
(Multiple Choice)
4.9/5 (38)
Control charts used to determine if the process distribution standard deviation has changed are:
(Multiple Choice)
4.9/5 (35)
20 samples of size 1,500 were drawn from a manufacturing process and the number of defectives in each sample was counted.The mean sample proportion was .020.The upper control limit for the p chart is:
(Multiple Choice)
4.9/5 (28)
50 samples of size 2,000 were taken from a production process that is under control.The mean of the sample proportions of defectives was .041.Calculate the centerline and control limits for the p chart.
(Essay)
4.8/5 (48)
Suppose previously your company decided that a process is out of control when the mean shifts by about 1 standard deviation.Now your company wants to declare a process as being out of control when the mean shifts by .50 standard deviations.In order to do this,the samples must be collected ____________________ often and/or the sample sizes must be ____________________.
(Short Answer)
4.9/5 (35)
25 Samples Production
25 samples of size 4 were taken from a manufacturing process.The mean of the sample means and the pooled standard deviation are  ,and S = 3.5,respectively.The sample means are listed below.
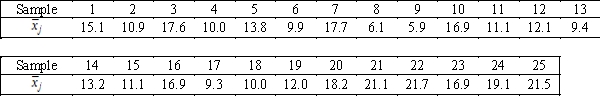
-{25 Samples Production Narrative} Find the centerline and control limits for the
-{25 Samples Production Narrative} Find the centerline and control limits for the  chart.
(Essay)
4.8/5 (35)
To construct a p chart,draw samples of size n,and for each sample calculate the sample ____________________ of defective units.
(Short Answer)
4.8/5 (39)
We construct a p chart to track the proportion of ____________________ units in a series of samples.
(Short Answer)
4.8/5 (30)
Which of the following is an example of assignable variation in a process?
(Multiple Choice)
4.7/5 (29)
A process capability index (Cp)of 2.0 describes a production process where the specification limits are equal to 3 standard errors above and below the centerline.
(True/False)
4.7/5 (35)
If the lower control limit of a p chart is negative,set it equal to ____________________.
(Short Answer)
4.8/5 (30)
The key to quality is to detect when the process goes out of control.The ____________________ chart is the statistical method that we use to detect problems.
(Short Answer)
4.9/5 (26)
If your control chart found a series of points all lying within 3 standard errors above the center line,and none lying below the centerline,this could be an indication of assignable variation due to a(n)____________________.
(Essay)
4.9/5 (32)
The mean of the sample means and the pooled standard deviation of 36 samples of size 9 taken from a production process under control are  ,and S = 6,respectively.The lower control limit of the 3-sigma
  chart is 147.
(True/False)
4.8/5 (39)
Assume a process has limits set at ±3 standard errors from the centerline.The average run length (ARL)is 385.What does this mean?
(Essay)
4.8/5 (35)
In statistical process control,a Type I error occurs if we conclude that the process is not in control when it actually is and requires that production is temporarily stopped.
(True/False)
4.8/5 (41)
Filters
- Essay(0)
- Multiple Choice(0)
- Short Answer(0)
- True False(0)
- Matching(0)