Exam 14: Introduction to Linear Regression and Correlation Analysis
Exam 1: The Where, why, and How of Data Collection167 Questions
Exam 2: Graphs,charts and Tablesdescribing Your Data138 Questions
Exam 3: Describing Data Using Numerical Measures130 Questions
Exam 4: Using Probability and Probability Distributions77 Questions
Exam 5: Discrete Probability Distributions119 Questions
Exam 6: Introduction to Continuous Probability Distributions90 Questions
Exam 7: Introduction to Sampling Distributions104 Questions
Exam 8: Estimating Single Population Parameters145 Questions
Exam 9: Introduction to Hypothesis Testing129 Questions
Exam 10: Estimation and Hypothesis Testing for Two Population Parameters97 Questions
Exam 11: Hypothesis Tests and Estimation for Population Variances71 Questions
Exam 12: Analysis of Variance137 Questions
Exam 13: Goodness-Of-Fit Tests and Contingency Analysis104 Questions
Exam 14: Introduction to Linear Regression and Correlation Analysis136 Questions
Exam 15: Multiple Regression Analysis and Model Building153 Questions
Exam 16: Analyzing and Forecasting Time-Series Data133 Questions
Exam 17: Introduction to Nonparametric Statistics104 Questions
Exam 18: Introduction to Quality and Statistical Process Control110 Questions
Exam 19: Introduction to Decision Analysis116 Questions
Select questions type
Assume that you have calculated a prediction of  = 110 where the specific value for x is equal to the average value of x.Also assume that n = 201 and that the standard error of the estimate is sε = 4.5.Find the approximate 95 percent prediction interval.
(Multiple Choice)
4.8/5  (35)
(35)
When the intercept in a regression equation is deemed not significantly different from 0,then in making predictions for y,0.0 should be used as the value of the intercept rather than the estimated intercept value.
(True/False)
4.7/5 (35)
Which of the following statements is true with respect to a simple linear regression model?
(Multiple Choice)
4.8/5 (30)
A correlation of -0.9 indicates a weak linear relationship between the variables.
(True/False)
4.9/5 (35)
If two variables are highly correlated,it not only means that they are linearly related,it also means that a change in one variable will cause a change in the other variable.
(True/False)
4.9/5 (24)
Both a scatter plot and the correlation coefficient can distinguish between a curvilinear and a linear relationship.
(True/False)
4.9/5 (34)
If the correlation coefficient for two variables is computed to be a -0.70,the scatter plot will show the data to be downward sloping from left to right.
(True/False)
4.7/5 (33)
In simple linear regression,the t-test for the slope and the F-test are both conducting the same hypothesis test.
(True/False)
4.8/5 (37)
A perfect correlation between two variables will always produce a correlation coefficient of +1.0.
(True/False)
4.8/5 (31)
A high coefficient of determination (R2)implies that the regression model will be a good predictor for future values of the dependent variable given the value of the independent variable.
(True/False)
4.9/5 (40)
You are given the following sample data for two variables: 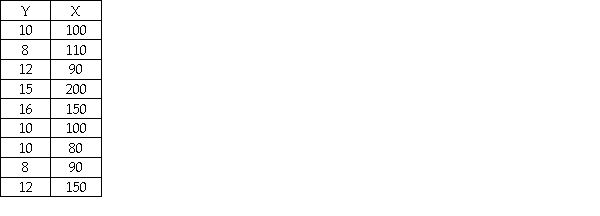 Based upon these sample data,and testing at the 0.05 level of significance,the critical value for testing whether the population correlation coefficient is equal to zero is t = 2.2622.
(True/False)
4.7/5 (39)
Given the following regression equation,the predicted value for y when x = 0.5 is about 4.57. 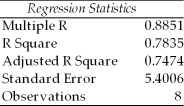 ANOVA
ANOVA 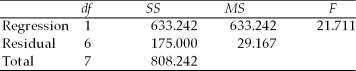
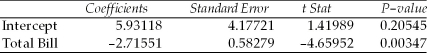
(True/False)
4.8/5 (38)
Given a sample of size n = 15 and a sample correlation of r = 0.7,the value of the test statistic for conducting a hypothesis test of the correlation is t = 3.53.
(True/False)
4.9/5 (31)
Explain what the correlation coefficient measures and some detail of the key issues associated with it.Be sure to also discuss the concept of spurious correlation.
(Essay)
4.7/5 (35)
Given a regression equation of  = 16 + 2.3x we would expect that an increase in x of 2.0 would lead to an average increase of y of 4.6.
(True/False)
5.0/5 (35)
If the correlation between two variables is known to be statistically significant at the 0.05 level,then the regression slope coefficient will also be significant at the 0.05 level.
(True/False)
4.8/5 (31)
If the R-square value for a simple linear regression model is .80,the correlation between the two variables is known to be .64.
(True/False)
4.8/5 (32)
In conducting a hypothesis test for a correlation,the correct probability distribution to use is the F distribution.
(True/False)
4.9/5 (25)
You are given the following sample data for two variables:  The sample correlation coefficient for these data is approximately r = 0.755.
(True/False)
4.9/5 (40)
If a simple least squares regression model is developed based on sample where the two variables are known to be positively correlated,the sum of the residuals will be positive.
(True/False)
4.8/5 (29)
Filters
- Essay(0)
- Multiple Choice(0)
- Short Answer(0)
- True False(0)
- Matching(0)