Exam 14: Introduction to Linear Regression and Correlation Analysis
Exam 1: The Where, why, and How of Data Collection167 Questions
Exam 2: Graphs,charts and Tablesdescribing Your Data138 Questions
Exam 3: Describing Data Using Numerical Measures130 Questions
Exam 4: Using Probability and Probability Distributions77 Questions
Exam 5: Discrete Probability Distributions119 Questions
Exam 6: Introduction to Continuous Probability Distributions90 Questions
Exam 7: Introduction to Sampling Distributions104 Questions
Exam 8: Estimating Single Population Parameters145 Questions
Exam 9: Introduction to Hypothesis Testing129 Questions
Exam 10: Estimation and Hypothesis Testing for Two Population Parameters97 Questions
Exam 11: Hypothesis Tests and Estimation for Population Variances71 Questions
Exam 12: Analysis of Variance137 Questions
Exam 13: Goodness-Of-Fit Tests and Contingency Analysis104 Questions
Exam 14: Introduction to Linear Regression and Correlation Analysis136 Questions
Exam 15: Multiple Regression Analysis and Model Building153 Questions
Exam 16: Analyzing and Forecasting Time-Series Data133 Questions
Exam 17: Introduction to Nonparametric Statistics104 Questions
Exam 18: Introduction to Quality and Statistical Process Control110 Questions
Exam 19: Introduction to Decision Analysis116 Questions
Select questions type
In a university statistics course a correlation of -0.8 was found between numbers of classes missed and course grade.This means that the fewer classes students missed the higher the grade.
(True/False)
4.8/5  (43)
(43)
Use the following regression results to answer the question below. 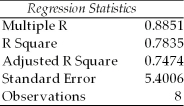 ANOVA
ANOVA 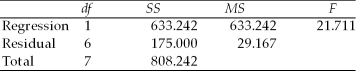
 Which of the following is true?
(Multiple Choice)
4.7/5 (43)
A recent study of 15 shoppers showed that the correlation between the time spent in the store and the dollars spent was 0.235.Using a significance level equal to 0.05,which of the following is the test statistic for testing whether the true population correlation is equal to zero?
(Multiple Choice)
4.8/5 (32)
A recent study by a major financial investment company was interested in determining whether the annual percentage change in stock price for companies is linearly related to the annual percent change in profits for the company.The following data was determined for 8 randomly selected companies: 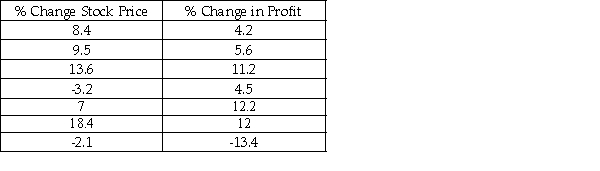 Based upon this sample information,what portion of variation in stock price percentage change is explained by the percent change in yearly income?
(Multiple Choice)
4.9/5 (40)
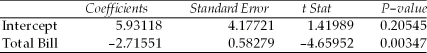
A study was recently performed by the Internal Revenue Service to determine how much tip income waiters and waitresses should make based on the size of the bill at each table.A random sample of bills and resulting tips were collected and the following regression results were observed:
SUMMARY OUTPUT 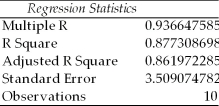 ANOVA
ANOVA 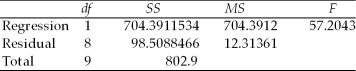
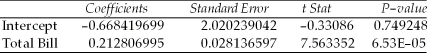 Given this output,the upper limit for the 95 percent confidence interval estimate for the true regression slope coefficient is approximately 0.28.
(True/False)
4.7/5 (25)
If a pair of variables have a strong curvilinear relationship,which of the following is true?
(Multiple Choice)
4.8/5 (32)
Consider the following partially completed computer printout for a regression analysis where the dependent variable is the price of a personal computer and the independent variable is the size of the hard drive. 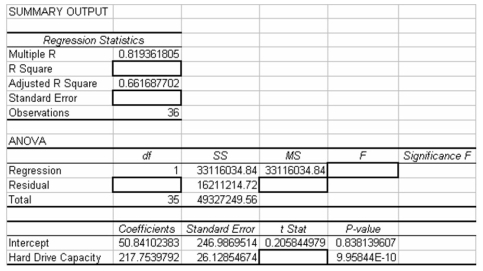 Based on the information provided,what is the estimate for the standard error of the estimate for the regression model?
(Multiple Choice)
4.8/5 (47)
The following regression model has been computed based on a sample of twenty observations:  = 34.2 + 19.3x.Given this model,the predicted value for y when x = 40 is 806.2.
(True/False)
4.8/5 (38)
Which of the following is NOT an assumption for the simple linear regression model?
(Multiple Choice)
4.8/5 (29)
A cellular phone service provider believes that there is negative correlation between the minutes used by its customers and the age of the customer.To test this,the following would be the appropriate null and alternative hypotheses: 
(True/False)
4.8/5 (39)
A study was recently done in which the following regression output was generated using Excel.
SUMMARY OUTPUT 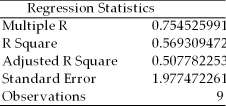 ANOVA
ANOVA 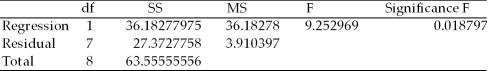
 Given this,we know that approximately 57 percent of the variation in y variable is explained by the x variable.
(True/False)
4.8/5 (37)
A positive population slope of 12 (β1 = 12)means that a 1-unit increase in x causes an average 12-unit increase in y.
(True/False)
4.8/5 (31)
Which of the following is a correct interpretation for the regression slope coefficient?
(Multiple Choice)
4.9/5 (35)
If the correlation of x and y is -0.65,then coefficient of determination is -0.4225.
(True/False)
4.9/5 (43)
In a simple regression model,if the regression model is deemed to be statistically significant,it means that the regression slope coefficient is significantly greater than zero.
(True/False)
4.9/5 (43)
The values of the regression coefficients are found such the sum of the residuals is minimized.
(True/False)
4.9/5 (42)
A dependent variable is the variable that we wish to predict or explain in a regression model.
(True/False)
4.9/5 (35)
In analyzing the relationship between two variables,a scatter plot can be used to detect which of the following?
(Multiple Choice)
4.8/5 (44)
If a simple least squares regression model is developed based on sample where the two variables are known to be positively correlated,the sign on the regression coefficient will be positive also.
(True/False)
4.9/5 (39)
The following regression output is available.Notice that some of the values are missing.  Given this information,what is the test statistic for testing whether the regression slope coefficient is equal to zero?
(Multiple Choice)
4.7/5 (31)
Filters
- Essay(0)
- Multiple Choice(0)
- Short Answer(0)
- True False(0)
- Matching(0)