Exam 14: Introduction to Linear Regression and Correlation Analysis
Exam 1: The Where, why, and How of Data Collection167 Questions
Exam 2: Graphs,charts and Tablesdescribing Your Data138 Questions
Exam 3: Describing Data Using Numerical Measures130 Questions
Exam 4: Using Probability and Probability Distributions77 Questions
Exam 5: Discrete Probability Distributions119 Questions
Exam 6: Introduction to Continuous Probability Distributions90 Questions
Exam 7: Introduction to Sampling Distributions104 Questions
Exam 8: Estimating Single Population Parameters145 Questions
Exam 9: Introduction to Hypothesis Testing129 Questions
Exam 10: Estimation and Hypothesis Testing for Two Population Parameters97 Questions
Exam 11: Hypothesis Tests and Estimation for Population Variances71 Questions
Exam 12: Analysis of Variance137 Questions
Exam 13: Goodness-Of-Fit Tests and Contingency Analysis104 Questions
Exam 14: Introduction to Linear Regression and Correlation Analysis136 Questions
Exam 15: Multiple Regression Analysis and Model Building153 Questions
Exam 16: Analyzing and Forecasting Time-Series Data133 Questions
Exam 17: Introduction to Nonparametric Statistics104 Questions
Exam 18: Introduction to Quality and Statistical Process Control110 Questions
Exam 19: Introduction to Decision Analysis116 Questions
Select questions type
Recently,an automobile insurance company performed a study of a random sample of 15 of its customers to determine if there is a positive relationship between the number of miles driven and the age of the driver.The sample correlation coefficient is r = .38.Given this information,which of the following is appropriate critical value for testing the null hypothesis at an alpha = .05 level?
(Multiple Choice)
4.9/5  (37)
(37)
Two variables have a correlation coefficient that is very close to zero.This means that there is no relationship between the two variables.
(True/False)
4.7/5 (30)
In a regression analysis situation,the standard error of the slope is:
(Multiple Choice)
4.9/5 (32)
A study was recently performed by the Internal Revenue Service to determine how much tip income waiters and waitresses should make based on the size of the bill at each table.A random sample of bills and resulting tips were collected.These data are shown as follows: 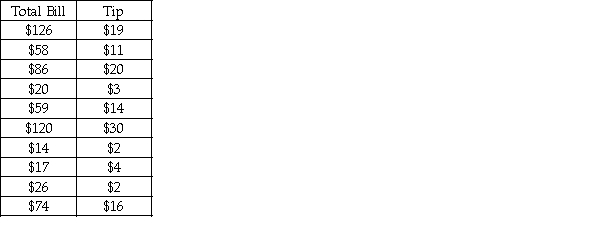 Based upon these data,what is the approximate predicted value for tips if the total bill is $100?
(Multiple Choice)
4.7/5 (35)
If two variables are spuriously correlated,it means that the correlation coefficient between them is near zero.
(True/False)
4.8/5 (39)
State University recently randomly sampled seven students and analyzed grade point average (GPA)and number of hours worked off-campus per week.The following data were observed:  In regression model with HOURS as the independent variable has an R-square equal to approximately .46.
(True/False)
4.7/5 (36)
A correlation coefficient computed from a sample of data values selected from a population is called a statistic and is subject to sampling error.
(True/False)
4.8/5 (30)
A bank is interested in determining whether its customers' checking balances are linearly related to their savings balances.A sample of n = 20 customers was selected and the correlation was calculated to be +0.40.If the bank is interested in testing to see whether there is a significant linear relationship between the two variables using a significance level of .05,the correct null and alternative hypotheses to test are: 
(True/False)
4.9/5 (37)
The following regression output was generated based on a sample of utility customers.The dependent variable was the dollar amount of the monthly bill and the independent variable was the size of the house in square feet. 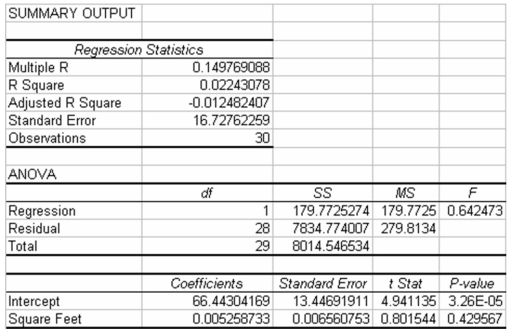 Based on this regression output,what is the 95 percent confidence interval estimate for the population regression slope coefficient?
(Multiple Choice)
5.0/5 (29)
A recent study of 15 shoppers showed that the correlation between the time spent in the store and the dollars spent was 0.235.Using a significance level equal to 0.05,which of the following is true?
(Multiple Choice)
4.8/5 (30)
The National Football League has performed a study in which the total yards gained by teams in games was used as an independent variable to explain the variation in total points scored by teams during games.The points scored ranged from 0 to 57 and the yards gained ranged from 187 to 569.The following regression model was determined:  = 12.3 + .12x. Given this model,which of the following statements is true?
(Multiple Choice)
4.9/5 (30)
A study was done in which the high daily temperature and the number of traffic accidents within the city were recorded.These sample data are shown as follows: 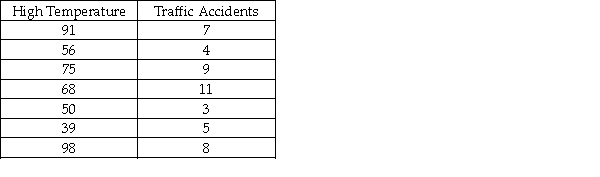 Given this data the sample correlation is:
(Multiple Choice)
4.9/5 (38)
In a study of 30 customers' utility bills in which the monthly bill was the dependent variable and the number of square feet in the house is the independent variable,the resulting regression model is  = 23.40 + 0.4x.Based on this model,the expected utility bill for a customer with a home with 2,300 square feet is approximately $92.00.
(True/False)
4.8/5 (33)
The difference between a scatter plot and a scatter diagram is that the scatter plot has the independent variable on the x-axis while the independent variable is on the Y-axis in a scatter diagram.
(True/False)
4.7/5 (27)
When the correlation coefficient for the two variables was -0.23,it implies that the two variables are not correlated because the correlation coefficient cannot be negative.
(True/False)
4.9/5 (33)
A bank is interested in determining whether its customers' checking balances are linearly related to their savings balances.A sample of n = 20 customers was selected and the correlation was calculated to be +0.40.If the bank is interested in testing to see whether there is a significant linear relationship between the two variables using a significance level of 0.05,the value of the test statistic is approximately t = 1.8516.
(True/False)
4.9/5 (26)
Consider the following partially completed computer printout for a regression analysis where the dependent variable is the price of a personal computer and the independent variable is the size of the hard drive. 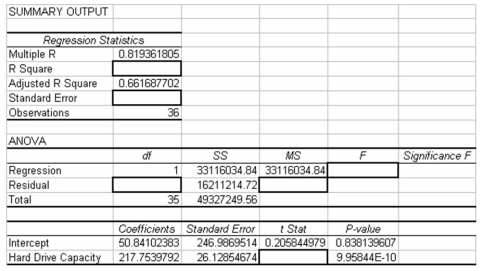 Based on the information provided,what percentage of the variation in the price of the personal computers is accounted for by the regression model using hard drive capacity as the independent variable?
(Multiple Choice)
4.9/5 (37)
The following regression output is available.Notice that some of the values are missing. 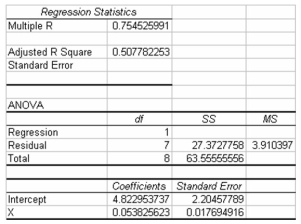 Given this information,what was the sample size used in the study?
(Multiple Choice)
4.8/5 (42)
If a sample of n = 30 people is selected and the sample correlation between two variables is r = 0.468,what is the test statistic value for testing whether the true population correlation coefficient is equal to zero?
(Multiple Choice)
4.7/5 (33)
State University recently randomly sampled seven students and analyzed grade point average (GPA)and number of hours worked off-campus per week.The following data were observed: 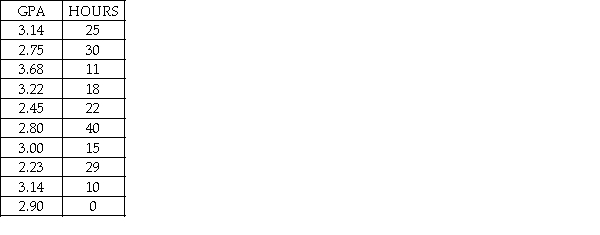 If the university wished to test the claim that the correlation between hours worked and GPA is negative,the following null and alternative hypotheses would be appropriate:
  : ρ < 0.0
  : ρ ≥ 0.0
(True/False)
4.7/5 (33)
Filters
- Essay(0)
- Multiple Choice(0)
- Short Answer(0)
- True False(0)
- Matching(0)