Exam 14: Introduction to Linear Regression and Correlation Analysis
Exam 1: The Where, why, and How of Data Collection167 Questions
Exam 2: Graphs,charts and Tablesdescribing Your Data138 Questions
Exam 3: Describing Data Using Numerical Measures130 Questions
Exam 4: Using Probability and Probability Distributions77 Questions
Exam 5: Discrete Probability Distributions119 Questions
Exam 6: Introduction to Continuous Probability Distributions90 Questions
Exam 7: Introduction to Sampling Distributions104 Questions
Exam 8: Estimating Single Population Parameters145 Questions
Exam 9: Introduction to Hypothesis Testing129 Questions
Exam 10: Estimation and Hypothesis Testing for Two Population Parameters97 Questions
Exam 11: Hypothesis Tests and Estimation for Population Variances71 Questions
Exam 12: Analysis of Variance137 Questions
Exam 13: Goodness-Of-Fit Tests and Contingency Analysis104 Questions
Exam 14: Introduction to Linear Regression and Correlation Analysis136 Questions
Exam 15: Multiple Regression Analysis and Model Building153 Questions
Exam 16: Analyzing and Forecasting Time-Series Data133 Questions
Exam 17: Introduction to Nonparametric Statistics104 Questions
Exam 18: Introduction to Quality and Statistical Process Control110 Questions
Exam 19: Introduction to Decision Analysis116 Questions
Select questions type
In a simple linear regression analysis,if the test statistic for testing the significance of the regression slope coefficient is 3.6,the F ratio from the analysis of variance table is known to be 12.96.
(True/False)
4.8/5  (34)
(34)
A research study has stated that the taxes paid by individuals is correlated at a .78 value with the age of the individual.Given this,the scatter plot would show points that would fall on straight line on a slope equal to .78.
(True/False)
4.7/5 (35)
Consider the following partially completed computer printout for a regression analysis where the dependent variable is the price of a personal computer and the independent variable is the size of the hard drive. 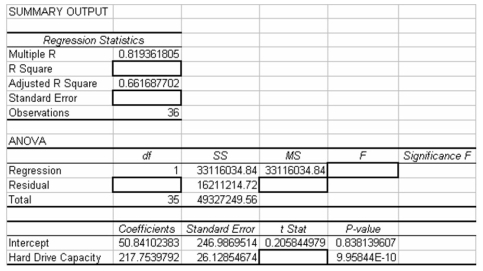 Based on the information provided,which of the following statements is true if alpha = .05?
(Multiple Choice)
4.8/5 (39)
When constructing a scatter plot,the dependent variable is placed on the vertical axis and the independent variable is placed on the horizontal axis.
(True/False)
4.7/5 (37)
A regression model that is deemed to have a regression slope coefficient that could be equal to zero should not be used for prediction since there is no established linear relationship between the x and y variable.
(True/False)
4.8/5 (36)
In developing a simple linear regression model it is assumed that the distribution of error terms will be normally distributed for all levels of x.
(True/False)
4.8/5 (38)
If two variables are related in a positive linear manner,the scatter plot will show points on the x,y space that are generally moving from the lower left to the upper right.
(True/False)
4.8/5 (38)
When using regression analysis for descriptive purposes,which of the following is of importance?
(Multiple Choice)
4.8/5 (35)
A recent study by a major financial investment company was interested in determining whether the annual percentage change in stock price for companies is linearly related to the annual percent change in profits for the company.The following data was determined for 8 randomly selected companies: 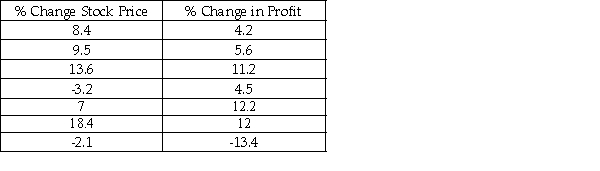 Based upon this sample information,which of the following is the regression equation?
(Multiple Choice)
4.9/5 (33)
The term that is given when two variables are correlated but there is no apparent connection between them is:
(Multiple Choice)
4.7/5 (22)
If the population correlation between two variables is determined to be -0.70,which of the following is known to be true?
(Multiple Choice)
4.8/5 (32)
A scatter plot is useful for identifying a linear relationship between the independent and dependent variable,but it is not particularly useful if the relationship is curvilinear.
(True/False)
4.9/5 (37)
If it is known that a simple linear regression model explains 56 percent of the variation in the dependent variable and that the slope on the regression equation is negative,then we also know that the correlation between x and y is approximately -0.75.
(True/False)
4.8/5 (28)
If the correlation between the dependent variable and the independent variable is negative,the standard error of the regression slope coefficient in a simple linear regression model will also be negative.
(True/False)
4.8/5 (33)
State University recently randomly sampled seven students and analyzed grade point average (GPA)and number of hours worked off-campus per week.The following data were observed: 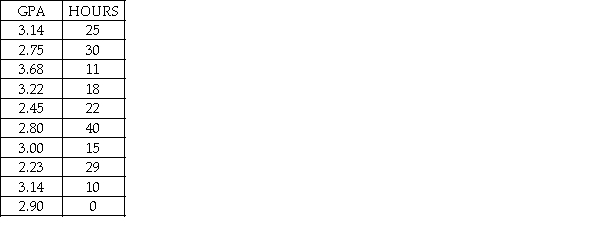 The correlation between these two variables is approximately -.461.
(True/False)
4.9/5 (34)
In a simple regression model,the slope coefficient represents the average change in the independent variable for a one-unit change in the dependent variable.
(True/False)
4.8/5 (25)
In a study of 30 customers' utility bills in which the monthly bill was the dependent variable and the number of square feet in the house is the independent variable,the resulting regression model is  = 23.40 + 0.4x.Given this,the sample correlation coefficient is known to be positive.
(True/False)
4.9/5 (35)
Given the data below,one ran the simple regression analysis of Y on X. 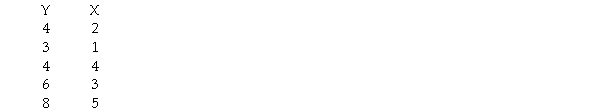 The relationship between Y and X is
(Multiple Choice)
4.9/5 (48)
Filters
- Essay(0)
- Multiple Choice(0)
- Short Answer(0)
- True False(0)
- Matching(0)