Exam 15: Multiple Regression Analysis and Model Building
Exam 1: The Where, why, and How of Data Collection167 Questions
Exam 2: Graphs,charts and Tablesdescribing Your Data138 Questions
Exam 3: Describing Data Using Numerical Measures130 Questions
Exam 4: Using Probability and Probability Distributions77 Questions
Exam 5: Discrete Probability Distributions119 Questions
Exam 6: Introduction to Continuous Probability Distributions90 Questions
Exam 7: Introduction to Sampling Distributions104 Questions
Exam 8: Estimating Single Population Parameters145 Questions
Exam 9: Introduction to Hypothesis Testing129 Questions
Exam 10: Estimation and Hypothesis Testing for Two Population Parameters97 Questions
Exam 11: Hypothesis Tests and Estimation for Population Variances71 Questions
Exam 12: Analysis of Variance137 Questions
Exam 13: Goodness-Of-Fit Tests and Contingency Analysis104 Questions
Exam 14: Introduction to Linear Regression and Correlation Analysis136 Questions
Exam 15: Multiple Regression Analysis and Model Building153 Questions
Exam 16: Analyzing and Forecasting Time-Series Data133 Questions
Exam 17: Introduction to Nonparametric Statistics104 Questions
Exam 18: Introduction to Quality and Statistical Process Control110 Questions
Exam 19: Introduction to Decision Analysis116 Questions
Select questions type
When the best subsets approach is used in a regression application,one method for determining which of the many possible models to select for potential use is called the Cp statistic.
(True/False)
4.8/5  (39)
(39)
Consider the following regression model:  = B0 + B1x1 +
  + ε.If B2 > 0,then the parabola will open downward and if B2 < 0,then the parabola will open downward.
(True/False)
5.0/5 (26)
A multiple regression is shown for a data set of yachts where the dependent variable is the price in thousands of dollars. 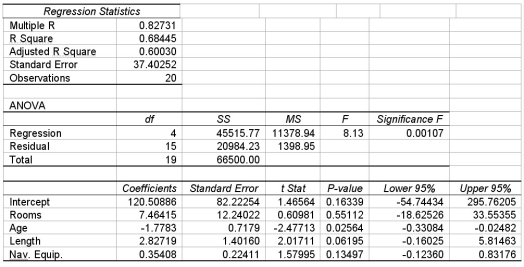 Given this information,what is the null hypothesis for testing the overall model?
(Multiple Choice)
4.7/5 (29)
The editors of a national automotive magazine recently studied 30 different automobiles sold in the United States with the intent of seeing whether they could develop a multiple regression model to explain the variation in highway miles per gallon.A number of different independent variables were collected.The following regression output (with some values missing)was recently presented to the editors by the magazine's analysts: 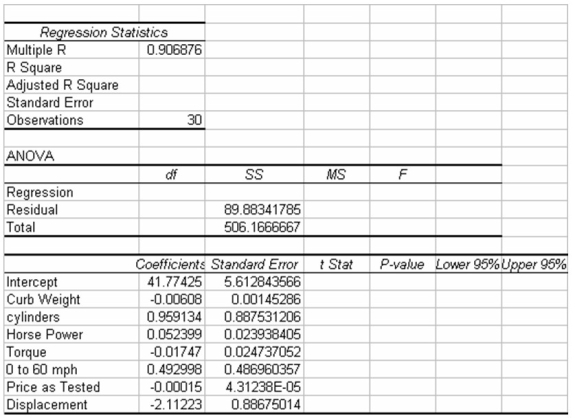 Based on this output and your understanding of multiple regression analysis,what is the value of the standard error of the estimate for this model?
(Multiple Choice)
4.8/5 (36)
When a regression equation includes a term such as x1x2 where two independent variables are multiplied,this is an interaction term.
(True/False)
4.9/5 (36)
The following regression output is the result of a multiple regression application in which we are interested in explaining the variation in retail price of personal computers based on three independent variables,CPU speed,RAM,hard drive capacity,and-monitor included (1=Yes,0=No). 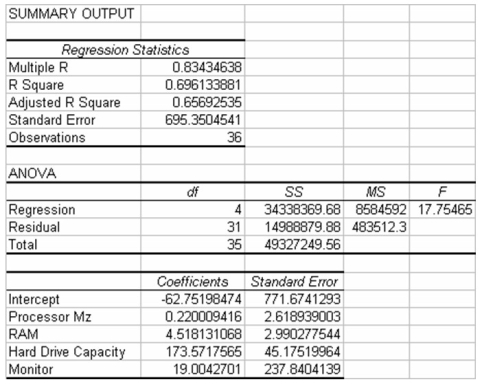 Given this output,what is the variable,Monitor,called? Also,given the other variables in the model,is Monitor significant in explaining the variation in the dependent variable? Test using a .05 level of alpha.
(Essay)
4.9/5 (39)
A study has recently been conducted by a major computer magazine publisher in which the objective was to develop a multiple regression model to explain the variation in price of personal computers.Three quantitative independent variables were used along with one qualitative variable.The qualitative variable was coded 1 if the computer included a monitor,0 otherwise.The following computer printout shows the final output. 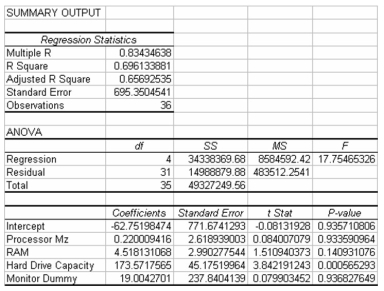 Based on this information,it is possible to determine that 4 of the PC's in the data set did not have a monitor included.
(True/False)
4.8/5 (34)
The following multiple regression output was generated from a study in which two independent variables are included.The first independent variable (X1)is a quantitative variable measured on a continuous scale.The second variable (X2)is qualitative coded 0 if Yes,1 if No. 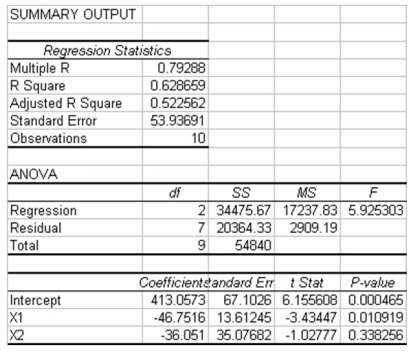 Based on this information,which of the following statements is true?
(Multiple Choice)
4.9/5 (33)
A multiple regression is shown for a data set of yachts where the dependent variable is the price in thousands of dollars.  Based on this output,which of the independent variables appear to be significantly helping to predict the price of a yacht,using a 0.10 level of significance?
(Multiple Choice)
4.9/5 (28)
In simple linear regression analysis,the regression model forms a straight line in two-dimensional space through the x,y data points,while a multiple regression model forms a plane through multidimensional space.
(True/False)
4.8/5 (30)
In a multiple regression analysis with three independent variables the null hypothesis for conducting the test of the overall model is:
Ho : β0 = β1 = β2 = β3 = 0.
(True/False)
4.8/5 (30)
A major car magazine has recently collected data on 30 leading cars in the U.S.market.It is interested in building a multiple regression model to explain the variation in highway miles.The following correlation matrix has been computed from the data collected:  If only one independent variable (ignoring city mileage)is to be used in explaining the dependent variable in a regression model,the percentage of variation that will be explained will be nearly 74 percent.
(True/False)
4.8/5 (37)
A decision maker has five potential independent variables with which to build a regression model to explain the variation in the dependent variable.At step 1,variable x3 enters the regression model.Which of the following indicates which of the four remaining independent variables will be next to enter the model?
(Multiple Choice)
4.8/5 (34)
In a multiple regression model,the adjusted R-square value measures the explained variation in the dependent variable after taking into account the relationship between the sample size and the number of independent variables in the model.
(True/False)
4.9/5 (35)
Which of the following is the difference between forward selection and standard stepwise regression?
(Multiple Choice)
4.8/5 (40)
Where there are two independent variables in a multiple regression,the regression equation forms a plane.
(True/False)
4.8/5 (24)
The forward selection method and the backward elimination method will always lead to choosing the same final regression model.
(True/False)
4.8/5 (22)
A multiple regression model of the form  = B0 + B1x + B2x2 + ε is called a second-degree polynomial model.
(True/False)
4.8/5 (28)
A major car magazine has recently collected data on 30 leading cars in the U.S.market.It is interested in building a multiple regression model to explain the variation in highway miles.The following correlation matrix has been computed from the data collected: 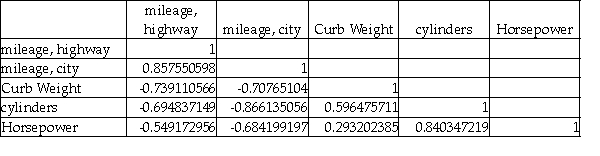 The analysts also produced the following multiple regression output using curb weight,cylinders,and horsepower as the three independent variables.Note,a number of the output fields are missing,but can be determined from the information provided.
 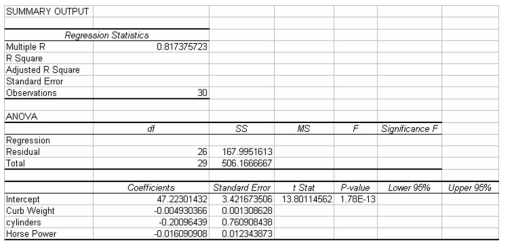 Based on the above information,the test statistic for testing whether the overall model is statistically significant is approximately F = 17.45.
(True/False)
4.7/5 (34)
Filters
- Essay(0)
- Multiple Choice(0)
- Short Answer(0)
- True False(0)
- Matching(0)