Exam 15: Multiple Regression Analysis and Model Building
Exam 1: The Where, why, and How of Data Collection167 Questions
Exam 2: Graphs,charts and Tablesdescribing Your Data138 Questions
Exam 3: Describing Data Using Numerical Measures130 Questions
Exam 4: Using Probability and Probability Distributions77 Questions
Exam 5: Discrete Probability Distributions119 Questions
Exam 6: Introduction to Continuous Probability Distributions90 Questions
Exam 7: Introduction to Sampling Distributions104 Questions
Exam 8: Estimating Single Population Parameters145 Questions
Exam 9: Introduction to Hypothesis Testing129 Questions
Exam 10: Estimation and Hypothesis Testing for Two Population Parameters97 Questions
Exam 11: Hypothesis Tests and Estimation for Population Variances71 Questions
Exam 12: Analysis of Variance137 Questions
Exam 13: Goodness-Of-Fit Tests and Contingency Analysis104 Questions
Exam 14: Introduction to Linear Regression and Correlation Analysis136 Questions
Exam 15: Multiple Regression Analysis and Model Building153 Questions
Exam 16: Analyzing and Forecasting Time-Series Data133 Questions
Exam 17: Introduction to Nonparametric Statistics104 Questions
Exam 18: Introduction to Quality and Statistical Process Control110 Questions
Exam 19: Introduction to Decision Analysis116 Questions
Select questions type
You should not include more than one categorical variable in a multiple regression because the use of two or more will cause misleading results.
(True/False)
4.9/5  (37)
(37)
When we say that we wish to determine the aptness of a regression model,we are actually saying that we wish to check to see whether the resulting model meets the basic assumptions of regression analysis.
(True/False)
4.8/5 (38)
In a second-order polynomial regression model,the regression coefficient,B2,will be positive if the parabola opens downward and negative when the parabola opens upward.
(True/False)
4.8/5 (37)
Stepwise regression is the approach that is always taken when developing a regression model to fit a curvilinear relationship between the dependent and potential independent variables.
(True/False)
4.8/5 (44)
A useful method for determining whether a linear function is the appropriate function to describe the relationship between the x and y variable is a residual plot in which the residuals are plotted on the vertical axis and the independent variable is on the horizontal axis.
(True/False)
5.0/5 (36)
A multiple regression is shown for a data set of yachts where the dependent variable is the price in thousands of dollars. 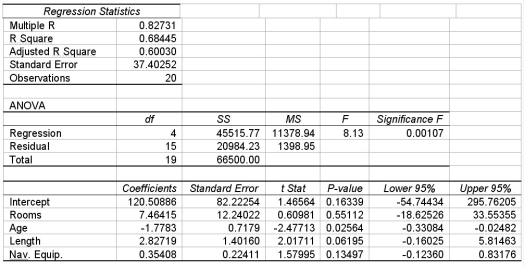 Given this information,which of the following is true regarding the slope coefficient for Age,where Age represents how many years old the yacht is?
(Multiple Choice)
4.9/5 (40)
The following regression output is the result of a multiple regression application in which we are interested in explaining the variation in retail price of personal computers based on three independent variables,CPU speed,RAM,and hard drive capacity.However,some of the regression output has been omitted. 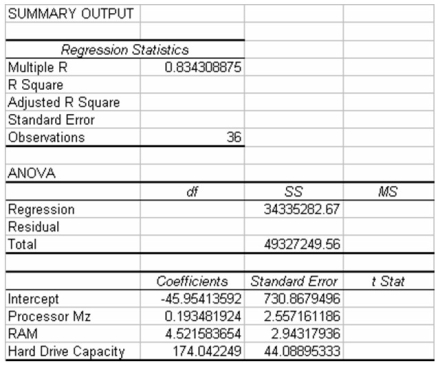 Given this information and your knowledge of multiple regression,what percentage of variation in the dependent variable is explained by the three independent variables in the model?
(Essay)
4.9/5 (36)
Consider the following scatter plot: 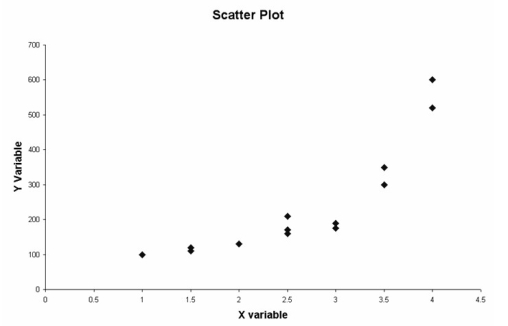 Given the apparent relationship between the x and y variable,a possible curvilinear regression model to consider would be a second-order polynomial model.
(True/False)
4.8/5 (37)
In a forward selection stepwise regression process,the second variable to be selected from the list of potential independent variables is always the one that has the second highest correlation with the dependent variable.
(True/False)
4.8/5 (33)
A major car magazine has recently collected data on 30 leading cars in the U.S.market.It is interested in building a multiple regression model to explain the variation in highway miles.The following correlation matrix has been computed from the data collected:  If the independent variables,curb weight,cylinders,and horsepower are used together in a multiple regression model,there may be a potential problem with multicollinearity since horsepower and cylinders are highly correlated.
(True/False)
4.7/5 (39)
In a multiple regression model,R-square can be computed by squaring the highest correlation coefficient between the dependent variable and any independent variable.
(True/False)
4.9/5 (35)
A decision maker is considering constructing a multiple regression model with two independent variables.The correlation between x1 and y is 0.70,and the correlation between variable x2 and y is 0.50.Based on this,the regression model containing both independent variables will explain 74 percent of the variation in the dependent variable.
(True/False)
4.8/5 (36)
The following output is for a second-order polynomial regression model where the independent variables are x and x2 (x^2).Some of the output has been omitted. 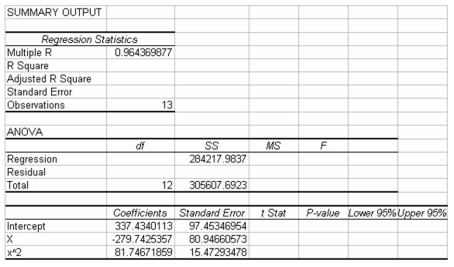 Considering the above information,both independent variables in the model are considered statistically significant at the alpha = 0.05 level.
(True/False)
4.8/5 (36)
Multicollinearity occurs when one or more independent variables is highly correlated with the dependent variable.
(True/False)
4.9/5 (31)
The editors of a national automotive magazine recently studied 30 different automobiles sold in the United States with the intent of seeing whether they could develop a multiple regression model to explain the variation in highway miles per gallon.A number of different independent variables were collected.The following regression output (with some values missing)was recently presented to the editors by the magazine's analysts: 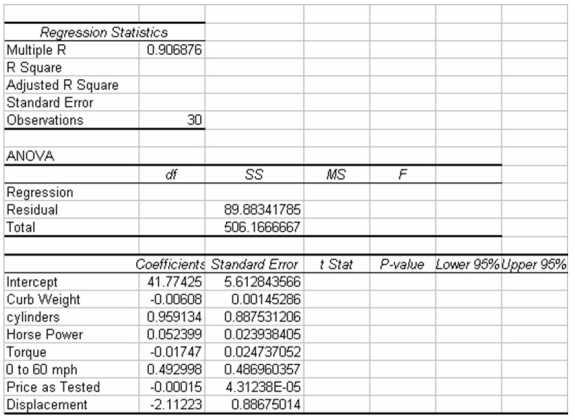 Based on this output and your understanding of multiple regression analysis,which of the independent variables is not considered statistically significant if the test is conducted at the 0.05 level of statistical significance?
(Multiple Choice)
4.8/5 (35)
A major car magazine has recently collected data on 30 leading cars in the U.S.market.It is interested in building a multiple regression model to explain the variation in highway miles.The following correlation matrix has been computed from the data collected: 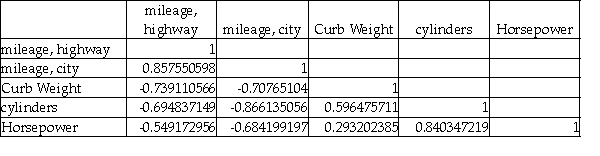 The analysts also produced the following multiple regression output using curb weight,cylinders,and horsepower as the three independent variables.Note,a number of the output fields are missing,but can be determined from the information provided.
 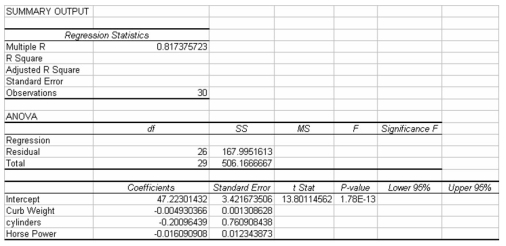 If the analysts are interested in testing whether the overall regression model is statistically significant,the appropriate null and alternative hypotheses are:
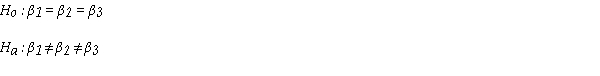
(True/False)
4.9/5 (27)
Filters
- Essay(0)
- Multiple Choice(0)
- Short Answer(0)
- True False(0)
- Matching(0)