Exam 15: Multiple Regression Analysis and Model Building
Exam 1: The Where, why, and How of Data Collection167 Questions
Exam 2: Graphs,charts and Tablesdescribing Your Data138 Questions
Exam 3: Describing Data Using Numerical Measures130 Questions
Exam 4: Using Probability and Probability Distributions77 Questions
Exam 5: Discrete Probability Distributions119 Questions
Exam 6: Introduction to Continuous Probability Distributions90 Questions
Exam 7: Introduction to Sampling Distributions104 Questions
Exam 8: Estimating Single Population Parameters145 Questions
Exam 9: Introduction to Hypothesis Testing129 Questions
Exam 10: Estimation and Hypothesis Testing for Two Population Parameters97 Questions
Exam 11: Hypothesis Tests and Estimation for Population Variances71 Questions
Exam 12: Analysis of Variance137 Questions
Exam 13: Goodness-Of-Fit Tests and Contingency Analysis104 Questions
Exam 14: Introduction to Linear Regression and Correlation Analysis136 Questions
Exam 15: Multiple Regression Analysis and Model Building153 Questions
Exam 16: Analyzing and Forecasting Time-Series Data133 Questions
Exam 17: Introduction to Nonparametric Statistics104 Questions
Exam 18: Introduction to Quality and Statistical Process Control110 Questions
Exam 19: Introduction to Decision Analysis116 Questions
Select questions type
The editors of a national automotive magazine recently studied 30 different automobiles sold in the United States with the intent of seeing whether they could develop a multiple regression model to explain the variation in highway miles per gallon.A number of different independent variables were collected.The following regression output (with some values missing)was recently presented to the editors by the magazine's analysts: 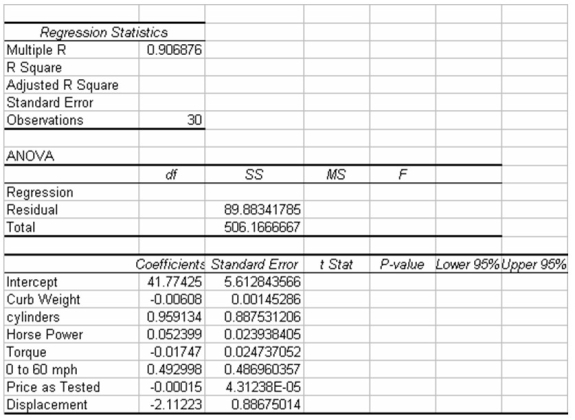 Based on this output and your understanding of multiple regression analysis,what percentage of variation in the dependent variable is explained by the regression model?
(Multiple Choice)
5.0/5  (35)
(35)
In a multiple regression analysis involving 15 independent variables and 200 observations,SST = 800 and SSE = 240.The adjusted coefficient of determination is
(Multiple Choice)
4.9/5 (28)
The following multiple regression was conducted to attempt to predict the price of yachts based on the independent variables shown. 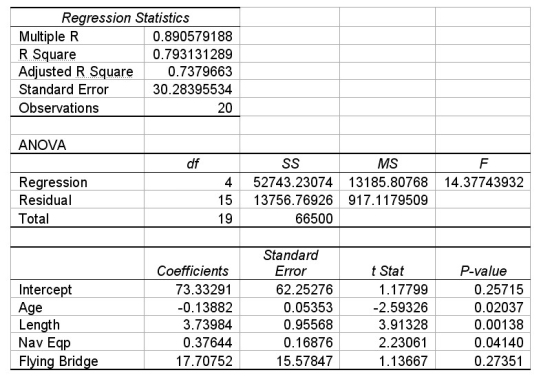 Given this information and your knowledge of multiple regression,determine which,if any,of the four independent variables are statistically significant in explaining the variation in the dependent variable.Use a 0.05 level of significance and use the p-value method.
(Essay)
4.8/5 (33)
In a multiple regression model,it is assumed that the errors or residuals are normally distributed.
(True/False)
4.7/5 (35)
Which of the following is not an indication of potential multicollinearity problems?
(Multiple Choice)
4.8/5 (35)
One reason for examining the adjusted R-square value in a multiple regression analysis is that the R-square value will increase just by adding additional independent variables to the model,whereas the adjusted R-square accounts for the relationship between the number of independent variables and the sample size and may actually decline if inappropriate independent variables are included in the model.
(True/False)
4.7/5 (32)
The following output is for a second-order polynomial regression model where the independent variables are x and x2 (x^2).Some of the output has been omitted. 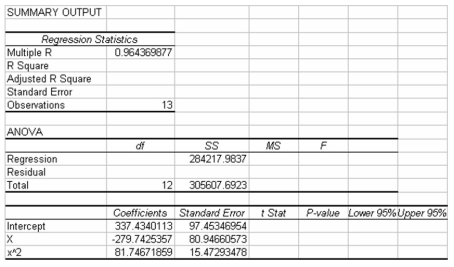 Considering the above information,it is clear that the second-order polynomial model will be a more effective regression model for explaining the variation in the y variable than would a linear regression model involving only one independent variable,x.
(True/False)
4.7/5 (39)
If one independent variable affects the relationship between a second independent variable and the dependent variable,it is said that there is interaction between the two independent variables.
(True/False)
4.9/5 (34)
A major car magazine has recently collected data on 30 leading cars in the U.S.market.It is interested in building a multiple regression model to explain the variation in highway miles.The following correlation matrix has been computed from the data collected: 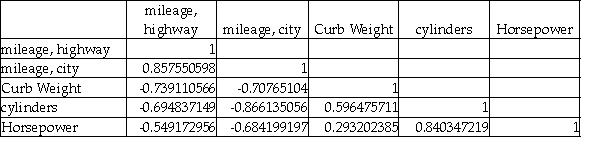 The analysts also produced the following multiple regression output using curb weight,cylinders,and horsepower as the three independent variables.Note,a number of the output fields are missing,but can be determined from the information provided.
 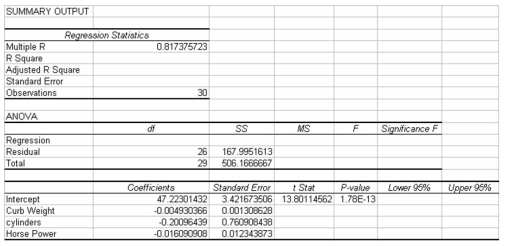 Based on the information provided,using a 0.05 level of statistical significance,both curb weight and horsepower are statistically significant variables in explaining the variation in the dependent variable when they are included in the model along with cylinders.
(True/False)
4.8/5 (29)
A multiple regression is shown for a data set of yachts where the dependent variable is the price in thousands of dollars. 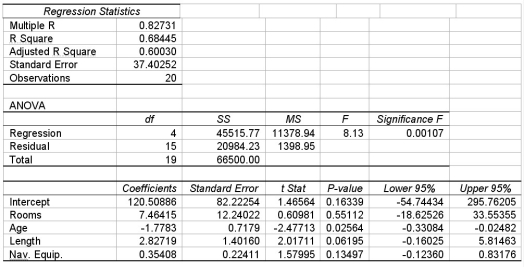 Given this information,which is correct regarding the test of the overall model using the 0.10 level of significance?
(Multiple Choice)
4.9/5 (40)
Interaction terms and polynomial terms should not be included in the same multiple regression model.
(True/False)
4.8/5 (35)
In the model diagnosis step in regression modeling,we are interested in the sign and size of the regression slope coefficients.
(True/False)
4.9/5 (32)
Golf handicaps are used to allow players of differing abilities to play against one another in a fair match.Recently a sample of golfers was selected in an effort to develop a model for explaining the difference in handicaps.One independent variable of interest is the number of rounds played per year.Another is whether or not the player is using an "original" name brand club or a copy.In recent years,a number of smaller golf club manufacturers have attempted to copy major golf club designs and sell "copies" of original clubs such as the Big Bertha by Calloway.To incorporate the type of club used,which of the following methods could be used?
(Multiple Choice)
4.8/5 (28)
The correlation matrix is an effective means of determining whether any of the independent variables has a curvilinear relationship with the dependent variable.
(True/False)
4.7/5 (40)
The following regression output is the result of a multiple regression application in which we are interested in explaining the variation in retail price of personal computers based on three independent variables,CPU speed,RAM,and hard drive capacity.However,some of the regression output has been omitted. 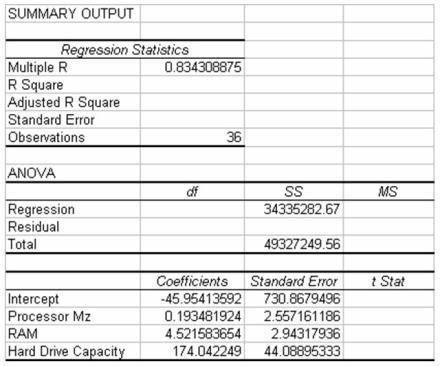 Given this information and your knowledge of multiple regression,what is the adjusted R-square value?
(Essay)
4.8/5 (31)
The editors of a national automotive magazine recently studied 30 different automobiles sold in the United States with the intent of seeing whether they could develop a multiple regression model to explain the variation in highway miles per gallon.A number of different independent variables were collected.The following regression output (with some values missing)was recently presented to the editors by the magazine's analysts:  Based on this output and your understanding of multiple regression analysis,which of the following statements is true?
(Multiple Choice)
4.8/5 (34)
In a multiple regression model,which of the following is true?
(Multiple Choice)
4.7/5 (27)
Filters
- Essay(0)
- Multiple Choice(0)
- Short Answer(0)
- True False(0)
- Matching(0)