Exam 15: Multiple Regression Analysis and Model Building
Exam 1: The Where, why, and How of Data Collection167 Questions
Exam 2: Graphs,charts and Tablesdescribing Your Data138 Questions
Exam 3: Describing Data Using Numerical Measures130 Questions
Exam 4: Using Probability and Probability Distributions77 Questions
Exam 5: Discrete Probability Distributions119 Questions
Exam 6: Introduction to Continuous Probability Distributions90 Questions
Exam 7: Introduction to Sampling Distributions104 Questions
Exam 8: Estimating Single Population Parameters145 Questions
Exam 9: Introduction to Hypothesis Testing129 Questions
Exam 10: Estimation and Hypothesis Testing for Two Population Parameters97 Questions
Exam 11: Hypothesis Tests and Estimation for Population Variances71 Questions
Exam 12: Analysis of Variance137 Questions
Exam 13: Goodness-Of-Fit Tests and Contingency Analysis104 Questions
Exam 14: Introduction to Linear Regression and Correlation Analysis136 Questions
Exam 15: Multiple Regression Analysis and Model Building153 Questions
Exam 16: Analyzing and Forecasting Time-Series Data133 Questions
Exam 17: Introduction to Nonparametric Statistics104 Questions
Exam 18: Introduction to Quality and Statistical Process Control110 Questions
Exam 19: Introduction to Decision Analysis116 Questions
Select questions type
If the R-square for a multiple regression model with two independent variables is .64,the correlation between the two independent variables will be .80.
(True/False)
4.8/5  (34)
(34)
In a forward selection stepwise regression process,the first variable to be selected will be the variable that can,by itself,do the most to explain the variation in the dependent variable.This will be the variable that provided the highest possible R-square value by itself.
(True/False)
4.8/5 (30)
If a decision maker has several potential independent variables to select from in building a regression model,the variable that,by itself,will always be the most effective in explaining the variation in the dependent variable will be the variable that has a correlation closest to positive 1.00.
(True/False)
4.9/5 (30)
The editors of a national automotive magazine recently studied 30 different automobiles sold in the United States with the intent of seeing whether they could develop a multiple regression model to explain the variation in highway miles per gallon.A number of different independent variables were collected.The following regression output is the result of using a forward selection stepwise regression approach. 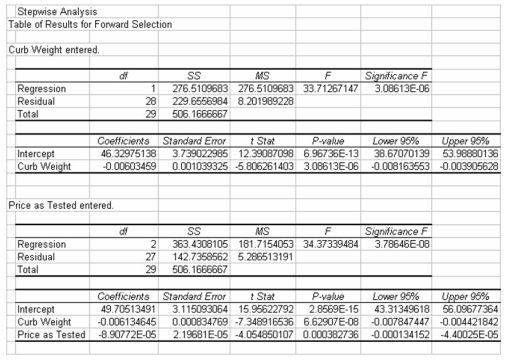 Which of the following might explain why no other independent variables entered the model?
(Multiple Choice)
4.9/5 (36)
The editors of a national automotive magazine recently studied 30 different automobiles sold in the United States with the intent of seeing whether they could develop a multiple regression model to explain the variation in highway mileage per gallon.A number of different independent variables were collected.The following correlation matrix was developed: 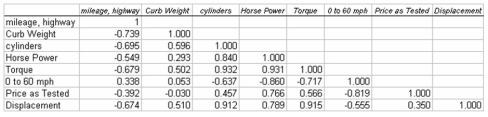 If only one variable were to be brought into the model,which variable should it be if the goal is to explain the highest possible percentage of variation in the dependent variable?
(Multiple Choice)
4.8/5 (36)
If there are six independent variables involved in a multiple regression,the best subsets method would involve trying how many different regression models?
(Multiple Choice)
4.9/5 (35)
The editors of a national automotive magazine recently studied 30 different automobiles sold in the United States with the intent of seeing whether they could develop a multiple regression model to explain the variation in highway miles per gallon.A number of different independent variables were collected.The following regression output (with some values missing)was recently presented to the editors by the magazine's analysts: 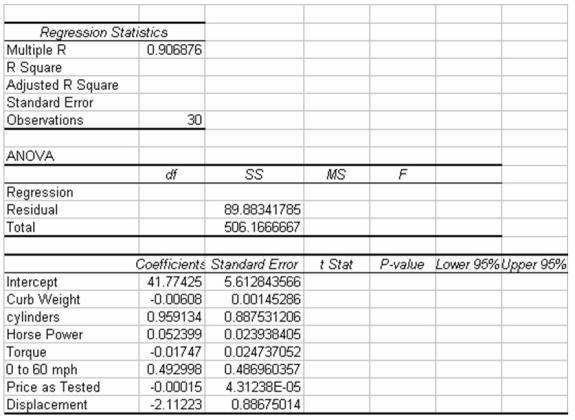 Based on this output and your understanding of multiple regression analysis,how many degrees of freedom are associated with the Residual in the ANOVA table?
(Multiple Choice)
4.9/5 (38)
In the best subsets approach to regression analysis,if we start with 4 independent variables,a total of 33 different regression models will actually be computed for possible selection as the best model to use.
(True/False)
4.8/5 (36)
The three components of the regression model building process are model specification,model fitting,and model diagnosis.
(True/False)
4.9/5 (37)
A complete polynomial model contains terms of all orders less than or equal to the pth order.
(True/False)
5.0/5 (39)
To describe variable credit status that has three levels: Excellent,Good,and Poor,we need to use two different dummy variables.
(True/False)
4.8/5 (34)
In curvilinear regression modeling,a composite model is one that contains either the basic terms or the interactive terms but not both.
(True/False)
4.8/5 (44)
In a multiple regression model,the regression slope coefficients measure the average change in the dependent variable for a one-unit change in the independent variable,all other variables held constant.
(True/False)
4.8/5 (44)
The best subsets method will involve trying fewer different regression models than stepwise regression.
(True/False)
4.9/5 (32)
A major car magazine has recently collected data on 30 leading cars in the U.S.market.It is interested in building a multiple regression model to explain the variation in highway miles.The following correlation matrix has been computed from the data collected: 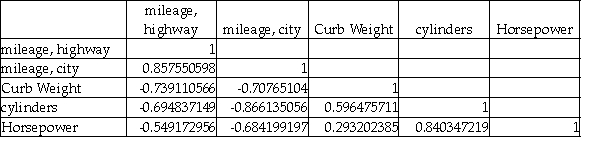 The analysts also produced the following multiple regression output using curb weight,cylinders,and horsepower as the three independent variables.Note that a number of the output fields are missing,but can be determined from the information provided.
 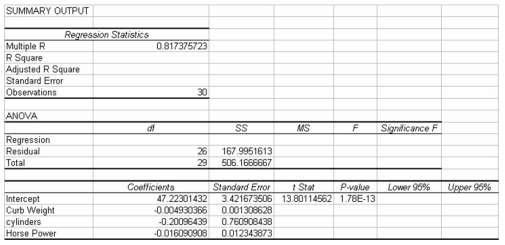 Based on the information provided,the three independent variables explain approximately 67 percent of the variation in the highway mileage among these 30 cars.
(True/False)
4.8/5 (26)
Consider the following regression equation:  = 356 + 180x1 - 2.5x2.The x1 variable is a quantitative variable and the x2 variable is a dummy with values 1 and 0.Given this,we can interpret the slope coefficient on variable x2 as follows: Holding x1 constant,if the value of x2 is changed from 0 to 1,the average value of y will decrease by 2.5 units.
(True/False)
4.8/5 (41)
In multiple regression analysis,the model will be developed with one dependent variable and two or more independent variables.
(True/False)
4.9/5 (37)
A correlation matrix shows the correlation between each independent variable and the dependent variable but gives no information about the potential for multicollinearity problems.
(True/False)
4.7/5 (25)
If a stepwise regression approach is used to enter,one at a time,four variables into a regression model,the resulting regression equation may differ from the regression equation that occurs when all four of the variables are entered at one step.
(True/False)
4.8/5 (33)
In a study of employees at a local company,the human resource manager wants to develop a multiple regression model to explain the difference in employee wage rates.She is thinking of including a variable,degree status,in which the following categories exist: no degree,H.S.degree,junior college degree,bachelor degree,graduate degree.One appropriate approach for including this variable is to code the categories 1,2,3,4,and 5.
(True/False)
4.9/5 (36)
Filters
- Essay(0)
- Multiple Choice(0)
- Short Answer(0)
- True False(0)
- Matching(0)