Exam 15: Nonparametric Methods: Nominal Level Hypothesis Tests
Exam 1: What Is Statistics83 Questions
Exam 2: Describing Data: Frequency Tables, Frequency Distributions, and Graphic Presentation132 Questions
Exam 3: Describing Data: Numerical Measures124 Questions
Exam 4: Describing Data: Displaying and Exploring Data113 Questions
Exam 5: A Survey of Probability Concepts134 Questions
Exam 6: Discrete Probability Distributions131 Questions
Exam 7: Continuous Probability Distributions135 Questions
Exam 8: Sampling Methods and the Central Limit Theorem117 Questions
Exam 9: Estimation and Confidence Intervals131 Questions
Exam 10: One-Sample Tests of Hypothesis110 Questions
Exam 11: Two-Sample Tests of Hypothesis98 Questions
Exam 12: Analysis of Variance134 Questions
Exam 13: Correlation and Linear Regression138 Questions
Exam 14: Multiple Regression Analysis135 Questions
Exam 15: Nonparametric Methods: Nominal Level Hypothesis Tests181 Questions
Exam 16: Nonparametric Methods: Analysis of Ordinal Data138 Questions
Exam 17: Index Numbers137 Questions
Exam 18: Time Series and Forecasting139 Questions
Exam 19: Statistical Process Control and Quality Management136 Questions
Exam 20: An Introduction to Decision Theory115 Questions
Select questions type
To test a hypothesis to verify that an observed frequency distribution data is normally distributed, the expected frequencies are _______________ distributed.
(Short Answer)
4.8/5  (33)
(33)
In a market test of a new chocolate raspberry coffee, a poll of 400 people (sample 1) from Dobbs Ferry showed 250 preferred the new coffee. In Irvington, 170 out of 350 people (sample 2) preferred the new coffee. To test the hypothesis that a higher proportion of people in Dobbs Ferry prefer the new coffee, what is the alternate hypothesis?
(Multiple Choice)
4.7/5 (40)
When testing a goodness-of-fit null hypothesis, and there are extremely large differences between observed and expected frequencies, the null hypothesis should be ___________.
(Short Answer)
4.9/5 (30)
A frequency distribution has a mean of 100 and a standard deviation of 20. The class limits for one class are 50 up to 60. What are the standard normal z-statistics for the class limits?
(Multiple Choice)
4.8/5 (33)
A random sample of 400 families who planned to buy a vacation residence revealed that 228 families want to buy a condominium in Florida. What is the test statistic to evaluate the statement that 55% of those families who plan to purchase a vacation residence in Florida want a condominium?
(Essay)
4.7/5 (37)
Recently, students in a marketing research class were interested in the driving behavior of students. Specifically, the marketing students were interested in finding out if exceeding the speed limit was related to social activity. They collected the following responses from 100 randomly selected students: 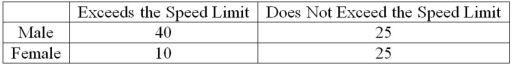 Using 0.05 as the significance level, what is the critical value for the test statistic?
(Multiple Choice)
4.7/5 (36)
A survey of property owners' opinions about a street-widening project was taken to determine if owners' opinions were related to the distance between their home and the street. A randomly selected sample of 100 property owners was contacted and the results are shown next. 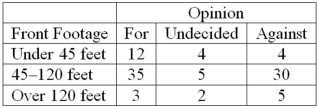 How many degrees of freedom are there?
(Multiple Choice)
4.7/5 (37)
It is claimed that in a bushel of peaches, less than 10% are defective. A sample of 400 peaches is examined and 50 are found to be defective. What is the z-test statistic?
(Multiple Choice)
4.8/5 (31)
A manufacturer claims that less than 1% of all its products do not meet the minimum government standards. A survey of 500 products revealed that 10 did not meet the standard. Thus, if α = .01, the critical value is ____________.
(Short Answer)
4.8/5 (33)
A recent study of the relationship between social activity and education for a sample of corporate executives showed the following results. 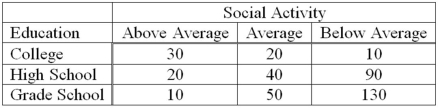 Using 0.05 as the significance level, what is the critical value for the test statistic?
(Multiple Choice)
4.9/5 (33)
In a contingency table, multiplying the row total by the column total and dividing by the ___________ computes the expected frequency for a cell.
(Short Answer)
4.9/5 (29)
When testing the null hypothesis that two population proportions are equal, the hypothesized difference between the population proportions is ________________.
(Short Answer)
4.8/5 (37)
A personnel manager is concerned about absenteeism. She decides to sample employee records to determine if absenteeism is distributed evenly throughout the six-day workweek. The null hypothesis is: Absenteeism is distributed evenly throughout the week. The 0.01 level is to be used. The sample results are: 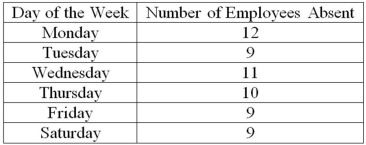 What is the calculated value of chi-square?
(Multiple Choice)
4.8/5 (23)
If we are testing for the difference between two population proportions, it is assumed that the two populations follow the ________________ distribution.
(Short Answer)
4.9/5 (45)
Based on the Nielsen ratings, the local CBS affiliate claims its 11 p.m. newscast reaches 41% of the viewing audience in the area. In a survey of 100 viewers, 36% indicated that they watch the late evening news on this local CBS station. What is the critical value if the level of significance is 0.10?
(Multiple Choice)
4.9/5 (33)
To compare the effect of weather on sales of soft drinks, a distributor surveyed people in two regions of the country and asked if they purchased soft drinks in the last month. The following are the results. The distributor would like to know if there is a difference in sales between the two regions. 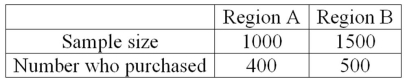 What is the alternate hypothesis?
(Essay)
5.0/5 (30)
The claim that "40% of those persons who retired from an industrial job before the age of 60 would return to work if a suitable job was available" is to be investigated at the 0.02 significance level. If 74 out of the 200 workers sampled said they would return to work, what is our decision?
(Multiple Choice)
4.9/5 (37)
A committee that is studying employer-employee relations proposed that each employee would rate his or her immediate supervisor, and in turn the supervisor would rate each employee. To test if the reactions to the survey for office and plant personnel were the same, 120 office personnel and 160 plant personnel were selected at random. Seventy-eight of the office personnel and 90 of the plant personnel were in favor of the proposal. What is the value of the test statistic? Round to two decimal places.
(Essay)
4.7/5 (43)
Filters
- Essay(0)
- Multiple Choice(0)
- Short Answer(0)
- True False(0)
- Matching(0)