Exam 15: Nonparametric Methods: Nominal Level Hypothesis Tests
Exam 1: What Is Statistics83 Questions
Exam 2: Describing Data: Frequency Tables, Frequency Distributions, and Graphic Presentation132 Questions
Exam 3: Describing Data: Numerical Measures124 Questions
Exam 4: Describing Data: Displaying and Exploring Data113 Questions
Exam 5: A Survey of Probability Concepts134 Questions
Exam 6: Discrete Probability Distributions131 Questions
Exam 7: Continuous Probability Distributions135 Questions
Exam 8: Sampling Methods and the Central Limit Theorem117 Questions
Exam 9: Estimation and Confidence Intervals131 Questions
Exam 10: One-Sample Tests of Hypothesis110 Questions
Exam 11: Two-Sample Tests of Hypothesis98 Questions
Exam 12: Analysis of Variance134 Questions
Exam 13: Correlation and Linear Regression138 Questions
Exam 14: Multiple Regression Analysis135 Questions
Exam 15: Nonparametric Methods: Nominal Level Hypothesis Tests181 Questions
Exam 16: Nonparametric Methods: Analysis of Ordinal Data138 Questions
Exam 17: Index Numbers137 Questions
Exam 18: Time Series and Forecasting139 Questions
Exam 19: Statistical Process Control and Quality Management136 Questions
Exam 20: An Introduction to Decision Theory115 Questions
Select questions type
To compare the effect of weather on sales of soft drinks, a distributor surveyed people in two regions of the country and asked if they purchased soft drinks in the last month. The following are the results. The distributor would like to know if there is a difference in sales between the two regions. 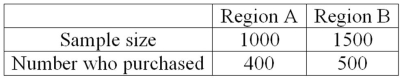 What is the value of the test statistic?
(Essay)
4.8/5  (39)
(39)
What is the critical value at the 0.05 level of significance for a goodness-of-fit test if there are six categories?
(Multiple Choice)
4.8/5 (34)
To compare the effect of weather on sales of soft drinks, a distributor surveyed people in two regions of the country and asked if they purchased soft drinks in the last month. The following are the results. The distributor would like to know if there is a difference in sales between the two regions.  What is the proportion of sales made in Region B?
(Essay)
4.8/5 (38)
How is a pooled estimate of the population proportion represented?
(Multiple Choice)
4.8/5 (39)
A survey of property owners' opinions about a street-widening project was taken to determine if owners' opinions were related to the distance between their home and the street. A randomly selected sample of 100 property owners was contacted and the results are shown next. 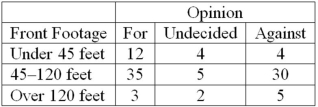 What are the degrees of freedom for testing the null hypothesis?
(Essay)
4.8/5 (38)
A personnel manager is concerned about absenteeism. She decides to sample employee records to determine if absenteeism is distributed evenly throughout the six-day workweek. The null hypothesis is: Absenteeism is distributed evenly throughout the week. The 0.01 level is to be used. The sample results are: 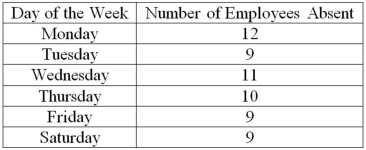 What is the expected frequency?
(Multiple Choice)
5.0/5 (37)
A survey of property owners' opinions about a street-widening project was taken to determine if owners' opinions were related to the distance between their home and the street. A randomly selected sample of 100 property owners was contacted and the results are shown next.  At the 5% level of significance, what is the critical value?
(Essay)
4.9/5 (33)
A survey of property owners' opinions about a street-widening project was taken to determine if owners' opinions were related to the distance between their home and the street. A randomly selected sample of 100 property owners was contacted and the results are shown next. 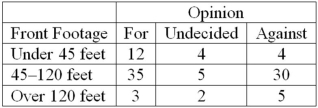 What is the expected frequency for people who are in favor of the project and have less than 45 feet of property foot-frontage?
(Multiple Choice)
4.8/5 (37)
The shape of the chi-square distribution depends on the size of the sample.
(True/False)
4.9/5 (45)
A personnel manager is concerned about absenteeism. She decides to sample employee records to determine if absenteeism is distributed evenly throughout the six-day workweek. The null hypothesis is: Absenteeism is distributed evenly throughout the week. Use the 0.01 level of significance. The sample results are:  How many degrees of freedom are there?
(Multiple Choice)
4.8/5 (43)
Three new colors have been proposed for the Jeep Grand Cherokee vehicle. They are silvered-blue, almond, and willow green. The null hypothesis for a goodness-of-fit test would be _______________.
(Multiple Choice)
4.9/5 (35)
For any goodness-of-fit test, the null hypothesis is that there is ____ difference between the expected and observed distributions.
(Short Answer)
5.0/5 (33)
For a contingency table test of independence, the formula to compute the degrees of freedom is __________________________________.
(Essay)
4.8/5 (31)
For any chi-square goodness-of-fit test, the number of degrees of freedom is found by ______.
(Multiple Choice)
5.0/5 (38)
Based on the Nielsen ratings, the local CBS affiliate claims its 11 p.m. newscast reaches 41% of the viewing audience in the area. In a survey of 100 viewers, 36% indicated that they watch the late evening news on this local CBS station. What is the alternate hypothesis?
(Multiple Choice)
4.8/5 (33)
A recent study of the relationship between social activity and education for a sample of corporate executives showed the following results. 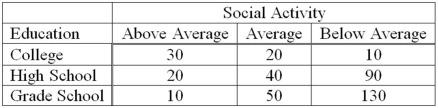 The degrees of freedom for the analysis are __________.
(Multiple Choice)
4.9/5 (42)
A sample of 250 adults tried the new multigrain cereal "Wow!" A total of 187 rated it as excellent. In a sample of 100 children, 66 rated it as excellent. Using the 0.1 significance level, the researcher wishes to show that adults like the cereal better than children. Which of the following is the alternate hypothesis?
(Multiple Choice)
4.9/5 (39)
A recent study of the relationship between social activity and education for a sample of corporate executives showed the following results. 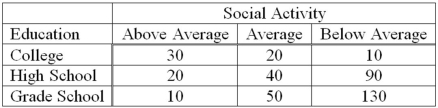 The null hypothesis for the analysis is __________________________.
(Multiple Choice)
4.9/5 (25)
We are interested in knowing if the following frequency distribution is normally distributed. The population mean and standard deviation of the data are 600 and 160, respectively. 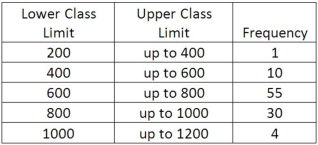 If the distribution was normally distributed, what is the expected frequency for the "400 up to 600" class?
(Essay)
4.8/5 (39)
We are interested in knowing if the following frequency distribution is normally distributed. The population mean and standard deviation of the data are 600 and 160, respectively. 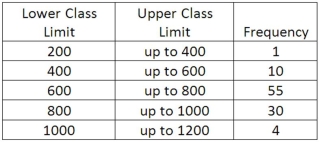 What are the standard normal z-statistic class limits for the "400 up to 600" class?
(Essay)
4.8/5 (34)
Filters
- Essay(0)
- Multiple Choice(0)
- Short Answer(0)
- True False(0)
- Matching(0)