Exam 15: Nonparametric Methods: Nominal Level Hypothesis Tests
Exam 1: What Is Statistics83 Questions
Exam 2: Describing Data: Frequency Tables, Frequency Distributions, and Graphic Presentation132 Questions
Exam 3: Describing Data: Numerical Measures124 Questions
Exam 4: Describing Data: Displaying and Exploring Data113 Questions
Exam 5: A Survey of Probability Concepts134 Questions
Exam 6: Discrete Probability Distributions131 Questions
Exam 7: Continuous Probability Distributions135 Questions
Exam 8: Sampling Methods and the Central Limit Theorem117 Questions
Exam 9: Estimation and Confidence Intervals131 Questions
Exam 10: One-Sample Tests of Hypothesis110 Questions
Exam 11: Two-Sample Tests of Hypothesis98 Questions
Exam 12: Analysis of Variance134 Questions
Exam 13: Correlation and Linear Regression138 Questions
Exam 14: Multiple Regression Analysis135 Questions
Exam 15: Nonparametric Methods: Nominal Level Hypothesis Tests181 Questions
Exam 16: Nonparametric Methods: Analysis of Ordinal Data138 Questions
Exam 17: Index Numbers137 Questions
Exam 18: Time Series and Forecasting139 Questions
Exam 19: Statistical Process Control and Quality Management136 Questions
Exam 20: An Introduction to Decision Theory115 Questions
Select questions type
When determining how well an observed set of frequencies fit an expected set of frequencies, what is the test statistic?
(Multiple Choice)
4.8/5  (33)
(33)
The computed chi-square value is positive because the difference between the observed and expected frequencies is _____________.
(Multiple Choice)
4.8/5 (41)
For a contingency table, the expected frequency for a cell is found by dividing the row total by the grand total.
(True/False)
4.8/5 (37)
Among 200 people surveyed, 66 people or 0.33% preferred the product. 0.33% is called the _______________.
(Short Answer)
4.8/5 (37)
The pooled estimate of the proportion is found by dividing the total number of samples by the total number of successes.
(True/False)
4.9/5 (28)
A frequency distribution has a mean of 200 and a standard deviation of 20. The class limits for one class are 220 up to 240. Based on the normal distribution, what is the probability that an observation would be in this class?
(Multiple Choice)
4.8/5 (34)
Recently, students in a marketing research class were interested in the driving behavior of students. Specifically, the marketing students were interested in finding out if exceeding the speed limit was related to gender. They collected the following responses from 100 randomly selected students: 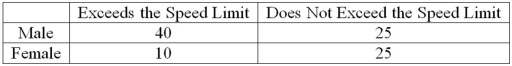 The null hypothesis for the analysis is ____________.
(Multiple Choice)
4.8/5 (34)
We are interested in knowing if the following frequency distribution is normally distributed. The population mean and standard deviation of the data are 600 and 160, respectively. 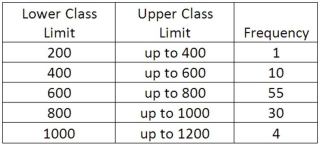 What are the standard normal z-statistic class limits for the "800 up to 1000" class?
(Essay)
4.8/5 (25)
Nonparametric tests require no assumptions about the shape of the population distribution.
(True/False)
4.8/5 (40)
We are interested in knowing if the following frequency distribution is normally distributed. The population mean and standard deviation of the data are 600 and 160, respectively. 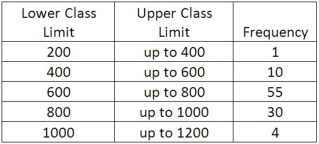 If the distribution was normally distributed, what is the probability that an observation would be a member of the "800 up to 1000" class?
(Essay)
4.7/5 (38)
Six people have declared their intentions to run for a seat on the school board in the next local election. A poll is conducted during the campaign among 1,020 randomly sampled voters to determine if there is any clear preference among the voters. The responses are shown next. 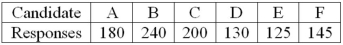 What is the alternative hypothesis?
(Essay)
4.8/5 (29)
There is not one, but a family of chi-square distributions. There is a chi-square distribution for 1 degree of freedom, another for 2 degrees of freedom, another for 3 degrees of freedom, and so on.
(True/False)
4.9/5 (40)
A survey of property owners' opinions about a street-widening project was taken to determine if owners' opinions were related to the distance between their home and the street. A randomly selected sample of 100 property owners was contacted and the results are shown next. 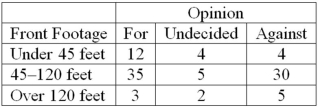 What is the critical value at the 10% level of significance?
(Multiple Choice)
4.8/5 (33)
As the degrees of freedom increase, the shape of a chi-square distribution approaches a ______________ distribution.
(Short Answer)
4.8/5 (40)
In testing the difference between two population proportions, we pool the two sample proportions to estimate the population proportion.
(True/False)
5.0/5 (31)
What is our decision for a goodness-of-fit test with a computed chi-square value of 1.273 and a critical value of 13.388?
(Multiple Choice)
4.8/5 (33)
Six people have declared their intentions to run for a seat on the school board in the next local election. A poll is conducted during the campaign among 1,020 randomly sampled voters to determine if there is any clear preference among the voters. The responses are shown next. 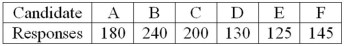 What is the null hypothesis?
(Essay)
4.9/5 (35)
A sample of 250 adults tried the new multigrain cereal "Wow!" A total of 187 rated it as excellent. In a sample of 100 children, 66 rated it as excellent. Using the 0.1 significance level, the researcher wishes to show that adults like the cereal better than children. What is the pooled proportion?
(Multiple Choice)
4.9/5 (31)
If 20 out of 50 students sampled live in a college dormitory, what is the estimated proportion of students at the University living in a dormitory?
(Multiple Choice)
4.9/5 (27)
Filters
- Essay(0)
- Multiple Choice(0)
- Short Answer(0)
- True False(0)
- Matching(0)