Exam 18: Time Series and Forecasting
Exam 1: Statistics and Data102 Questions
Exam 2: Tabular and Graphical Methods123 Questions
Exam 3: Numerical Descriptive Measures152 Questions
Exam 4: Introduction to Probability148 Questions
Exam 5: Discrete Probability Distributions158 Questions
Exam 6: Continuous Probability Distributions143 Questions
Exam 7: Sampling and Sampling Distributions136 Questions
Exam 8: Interval Estimation131 Questions
Exam 9: Hypothesis Testing116 Questions
Exam 10: Statistical Inference Concerning Two Populations131 Questions
Exam 11: Statistical Inference Concerning Variance120 Questions
Exam 12: Chi-Square Tests120 Questions
Exam 13: Analysis of Variance120 Questions
Exam 14: Regression Analysis140 Questions
Exam 15: Inference With Regression Models125 Questions
Exam 16: Regression Models for Nonlinear Relationships118 Questions
Exam 17: Regression Models With Dummy Variables130 Questions
Exam 18: Time Series and Forecasting125 Questions
Exam 19: Returns, Index Numbers, and Inflation120 Questions
Exam 20: Nonparametric Tests120 Questions
Select questions type
Based on quarterly data collected over the last four years, the following regression equation was found to forecast the quarterly demand for the number of new copies of an economics textbook:  t = 3,305 - 665Qtr1 - 1,335Qtr2 + 305Qtr3, where Qtr1, Qtr2, and Qtr3 are dummy variables corresponding to Quarters 1, 2, and 3. The demand forecast for Quarter 2 of the next year is ________.
(Multiple Choice)
4.8/5  (29)
(29)
In the model yt = β0 + β1yt-1 + εt, the parameter β1 represents the ________ of the lagged response variable y.
(Short Answer)
4.9/5 (30)
Which of the following is true of the exponential smoothing method?
(Multiple Choice)
4.8/5 (39)
The following table shows the annual revenues (in millions of dollars) of a pharmaceutical company over the period 1990-2011. 
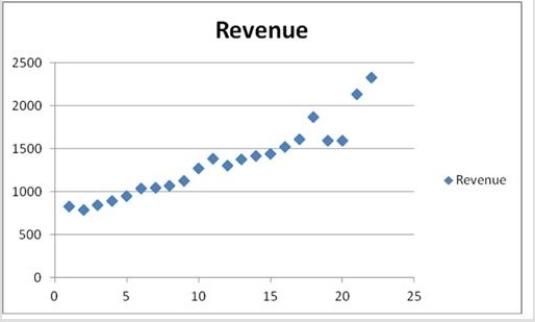 The scatterplot indicates that the annual revenues have an increasing trend. Linear, exponential, quadratic, and cubic models were fit to the data starting with t = 1, and the following output was generated.
  When three polynomial trend equations are compared, which of them provides the best fit?
(Multiple Choice)
4.8/5 (35)
The following ratio-to-moving averages for the seasonally adjusted series were found by the decomposition method applied on a time series representing quarterly sales for the last three years:  If the trend is described by the trend line
  = 1,000 + 30t, what is the forecast for the fourth quarter of this year?
(Multiple Choice)
4.8/5 (43)
Quarterly sales of a department store for the last seven years are given in the following table. 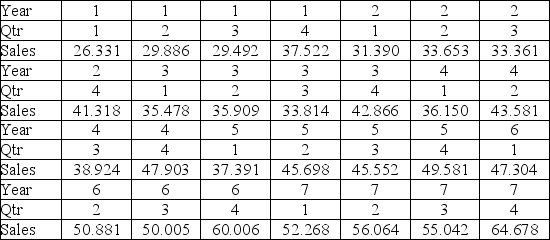
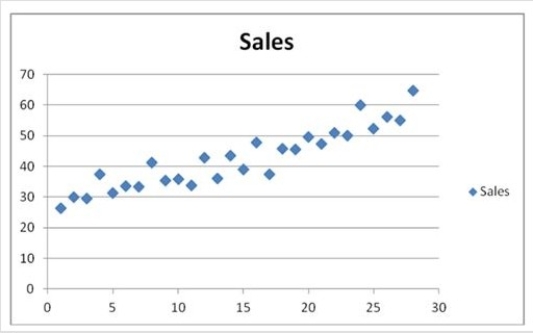 The scatterplot shows that the quarterly sales have an increasing trend and seasonality. A linear regression model given by, Sales = β0 + β1Qtr1 + β2Qtr2 + β3Qtr3 + β4t + ε, where t is the time period (t = 1, ..., 28) and Qtr1, Qtr2, and Qtr3 are quarter dummies, is estimated and then used to make forecasts. For the regression model, the following partial output is available.
  Using the decomposition method:
A) Compute the adjusted seasonal indices for the four quarters.
B) Find the linear trend equation for the seasonally adjusted quarterly sales.
C) Make the sales forecasts for the first and fourth quarter of Year 8.
Using the decomposition method:
A) Compute the adjusted seasonal indices for the four quarters.
B) Find the linear trend equation for the seasonally adjusted quarterly sales.
C) Make the sales forecasts for the first and fourth quarter of Year 8.
(Essay)
4.8/5 (37)
Causal forecasting models are based on a regression model framework, where the variable of interest depends on one or more explanatory variables.
(True/False)
4.9/5 (45)
If the regression framework is used to describe monthly seasonal data, how many dummy variables are needed?
(Multiple Choice)
4.8/5 (35)
Using the decomposition model yt = Tt × St × It , forecasts are made by ________, where  t and
t and  t represent the estimated trend and the (adjusted) seasonal index for period t, respectively.
(Multiple Choice)
4.7/5 (34)
The optimal value of the speed of decline in the exponential smoothing procedure is determined by a(n) ________ method.
(Short Answer)
4.8/5 (40)
Which of the following models is considered for a quarterly time series that seems to change on average by a fixed amount and seems to have seasonality?
(Multiple Choice)
4.9/5 (42)
The exponential smoothing method weighs all available observations in a time series equally.
(True/False)
4.8/5 (39)
Based on quarterly data collected over the last five years, the following regression equation was found to forecast the quarterly demand for the number of new copies of a business statistics textbook:  t = 2,298 - 6,635Qtr1 - 1,446Qtr2 + 303Qtr3 + 26t, where Qtr1, Qtr2, and Qtr3 are dummy variables corresponding to Quarters 1, 2, and 3, and t = time period starting with t = 1. For a given year, the demand in Quarter 3 is on average ________.
(Multiple Choice)
4.8/5 (41)
The following ratio-to-moving averages for the seasonally adjusted series were found by the decomposition method applied on a time series representing quarterly sales for the last three years:  By what percent does the sales in Quarter 4 exceed the average quarterly sales?
(Multiple Choice)
4.9/5 (30)
Which of the following models is assumed for a quarterly time series that seems to grow on average by an increasing amount (or decline by a decreasing amount) and seems to have seasonality?
(Multiple Choice)
4.8/5 (31)
The cyclical component of a time series typically represents repetitions within a one-year period.
(True/False)
4.9/5 (39)
When the increase in the series gets larger over time, it is attractive to use a(an) ________ trend model.
(Short Answer)
5.0/5 (33)
A polynomial trend model that only allows one change in the direction of a series is known as a(n) ________.
(Multiple Choice)
4.8/5 (46)
Noncausal forecasting models are purely time series models in the sense that the forecasts are made based only on historical data concerning the variable of interest.
(True/False)
4.8/5 (39)
Filters
- Essay(0)
- Multiple Choice(0)
- Short Answer(0)
- True False(0)
- Matching(0)