Exam 18: Time Series and Forecasting
Exam 1: Statistics and Data102 Questions
Exam 2: Tabular and Graphical Methods123 Questions
Exam 3: Numerical Descriptive Measures152 Questions
Exam 4: Introduction to Probability148 Questions
Exam 5: Discrete Probability Distributions158 Questions
Exam 6: Continuous Probability Distributions143 Questions
Exam 7: Sampling and Sampling Distributions136 Questions
Exam 8: Interval Estimation131 Questions
Exam 9: Hypothesis Testing116 Questions
Exam 10: Statistical Inference Concerning Two Populations131 Questions
Exam 11: Statistical Inference Concerning Variance120 Questions
Exam 12: Chi-Square Tests120 Questions
Exam 13: Analysis of Variance120 Questions
Exam 14: Regression Analysis140 Questions
Exam 15: Inference With Regression Models125 Questions
Exam 16: Regression Models for Nonlinear Relationships118 Questions
Exam 17: Regression Models With Dummy Variables130 Questions
Exam 18: Time Series and Forecasting125 Questions
Exam 19: Returns, Index Numbers, and Inflation120 Questions
Exam 20: Nonparametric Tests120 Questions
Select questions type
Based on quarterly data collected over the last four years, the following regression equation was found to forecast the quarterly demand for the number of new copies of an economics textbook:  t = 3,305 - 665Qtr1 - 1,335Qtr2 + 305Qtr3, where Qtr1, Qtr2, and Qtr3 are dummy variables corresponding to Quarters 1, 2, and 3. Which of the following is not true?
(Multiple Choice)
4.8/5  (43)
(43)
The model yt = β0 + β1yt - 1 + εt is known as a(n) ________.
(Multiple Choice)
4.7/5 (33)
The ________ method is a smoothing technique based on computing the average from a fixed number of the most recent observations.
(Multiple Choice)
4.9/5 (38)
The following table includes the information about a monthly time series.  What is the forecast for May when the three-month moving average method is applied?
(Multiple Choice)
4.9/5 (42)
The following table includes the information about a monthly time series. 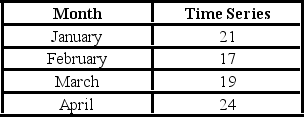 When the exponential smoothing method with α = 0.5 is applied, what is the MSE?
(Multiple Choice)
4.9/5 (34)
The following table shows the annual revenues (in millions of dollars) of a pharmaceutical company over the period 1990-2011. 
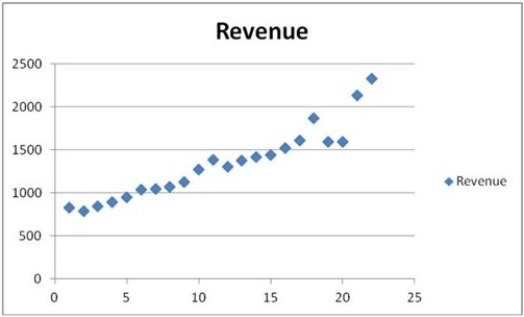 The scatterplot indicates that the annual revenues have an increasing trend. Linear, exponential, quadratic, and cubic models were fit to the data starting with t = 1, and the following output was generated.
  Which of the following is a revenue forecast for 2012 found by the polynomial trend equation with the best fit?
(Multiple Choice)
4.9/5 (37)
Smoothing techniques are suitable for use when forecasts need to be updated frequently due to new observations that become available.
(True/False)
4.9/5 (39)
The following table includes the information about a monthly time series.  What is the forecast for May using the exponential smoothing method with α = 0.5?
(Multiple Choice)
4.9/5 (39)
With the method of seasonal dummy variables, we estimate a trend forecasting model that includes ________ variables to capture seasonal variations.
(Short Answer)
4.8/5 (25)
Quantitative forecasting procedures are based on the judgment of the forecaster, who uses prior experience and expertise to make forecasts.
(True/False)
4.9/5 (41)
The following table shows the annual revenues (in millions of dollars) of a pharmaceutical company over the period 1990-2011. 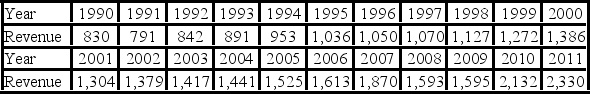 The autoregressive models of order 1 and 2, yt = β0 + β1yt - 1 + εt, and yt = β0 + β1yt - 1 + β2yt - 2 + εt, were applied on the time series to make revenue forecasts. The relevant parts of Excel regression outputs are given below.
Model AR(1):
The autoregressive models of order 1 and 2, yt = β0 + β1yt - 1 + εt, and yt = β0 + β1yt - 1 + β2yt - 2 + εt, were applied on the time series to make revenue forecasts. The relevant parts of Excel regression outputs are given below.
Model AR(1): 
 Model AR(2):
 Using the AR(1) model, find the company revenue forecast for 2012.
(Essay)
5.0/5 (31)
The following table shows the annual revenues (in millions of dollars) of a pharmaceutical company over the period 1990-2011. 
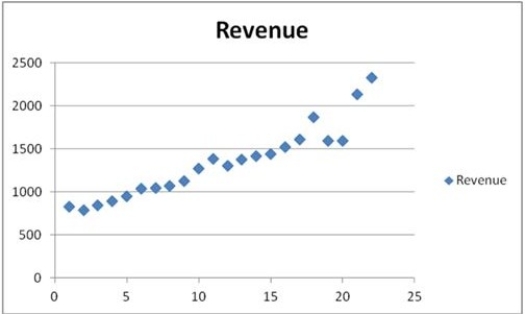 The scatterplot indicates that the annual revenues have an increasing trend. Linear, exponential, quadratic, and cubic models were fit to the data starting with t = 1, and the following output was generated.
  Which of the following is a linear trend equation?
(Multiple Choice)
4.9/5 (27)
When a time series is analyzed by the model yt = Tt × St × It and the trend component Tt is set to be the centered moving average  t, which of the following remains to be estimated?
(Multiple Choice)
4.7/5 (37)
If there are T observations to estimate the lagged regression model yt = β0 + β1xt - 1 + εt, what is the actual number of observations used to make the forecast for time period T?
(Multiple Choice)
4.9/5 (37)
A seasonal component differs from a cyclical component in that the seasonal component ________.
(Multiple Choice)
4.8/5 (34)
Which of the following is not true of seasonal dummy variables?
(Multiple Choice)
4.7/5 (31)
In the decomposition method, which of the following time series is used to estimate the trend?
(Multiple Choice)
4.9/5 (42)
If T denotes the number of observations, which of the following equations represents the one-step-ahead forecast for the model yt = β0 + β1xt + εt?
(Multiple Choice)
4.7/5 (32)
The following table includes the information about a monthly time series.  When a forecast is made by the three-month moving average method, all three monthly observations used to make this forecast are treated equally in the sense that each of them has the same weight of 1/3. What is the forecast for May when the three-month weighted moving average method is applied with the weights: 1/6, 2/6, and 3/6? Assign the smallest weight to the oldest data and the largest weight to the most recent data.
(Multiple Choice)
4.8/5 (43)
Based on quarterly data collected over the last five years, the following regression equation was found to forecast the quarterly demand for the number of new copies of a business statistics textbook:  t = 2,298 - 6635Qtr1 - 1,446Qtr2 + 303Qtr3 + 26t, where Qtr1, Qtr2, and Qtr3 are dummy variables corresponding to Quarters 1, 2, and 3, and t = time period starting with t = 1. The demand forecast for the second quarter of the next year is ________.
(Multiple Choice)
4.9/5 (36)
Filters
- Essay(0)
- Multiple Choice(0)
- Short Answer(0)
- True False(0)
- Matching(0)