Exam 19: Statistical Methods for Quality Control
Exam 1: Data and Statistics85 Questions
Exam 2: Descriptive Statistics: Tabular and Graphical Displays112 Questions
Exam 3: Descriptive Statistics: Numerical Measures139 Questions
Exam 4: Introduction to Probability129 Questions
Exam 5: Discrete Probability Distributions150 Questions
Exam 6: Continuous Probability Distributions144 Questions
Exam 7: Sampling and Sampling Distributions119 Questions
Exam 8: Interval Estimation118 Questions
Exam 9: Hypothesis Tests118 Questions
Exam 10: Inference About Means and Proportions With Two Populations127 Questions
Exam 11: Inferences About Population Variances113 Questions
Exam 12: Tests of Goodness of Fit, Independence and Multiple Proportions76 Questions
Exam 13: Experimental Design and Analysis of Variance125 Questions
Exam 14: Simple Linear Regression103 Questions
Exam 15: Multiple Regression109 Questions
Exam 16: Regression Analysis: Model Building82 Questions
Exam 17: Time Series Analysis and Forecasting80 Questions
Exam 18: Nonparametric Methods83 Questions
Exam 19: Statistical Methods for Quality Control75 Questions
Exam 20: Decision Analysis71 Questions
Exam 21: Sample Survey68 Questions
Select questions type
In practice, it is common to use the sample _____ to estimate the process _________.
(Multiple Choice)
4.9/5  (27)
(27)
In acceptance sampling, the risk of accepting a poor quality lot is known as
(Multiple Choice)
4.9/5 (39)
To inspect incoming shipments of components, a manufacturer is considering samples of sizes 12, 15, and 18. Use binomial probabilities to select a sampling plan that provides a producer's risk of = .12 when p0 is .04 and a consumer's risk of = .08 when p1 is .25.
(Short Answer)
4.9/5 (32)
__________ consist(s) of making a series of inspections and measurements to determine whether quality standards are being met.
(Multiple Choice)
4.8/5 (41)
Harry Coates wants to construct  and R charts at the bag-filling operation for Meow Chow cat food. He knows that when the filling operation is functioning correctly, bags of cat food should average 50.00 pounds and 5-bag samples should have an average range of .330 pounds.Harry had twenty 5-bag samples taken at 2-hour intervals and the sample means and ranges are shown below. Determine the center lines and upper and lower control limits for the
  and R charts.
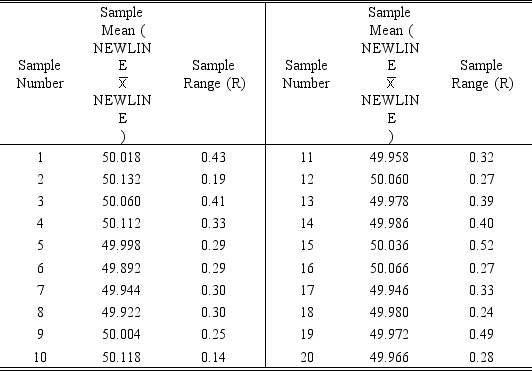
(Essay)
4.9/5 (30)
Every check cashed or deposited at Lincoln Bank must be encoded with the amount of the check before it can begin the Federal Reserve clearing process. The accuracy of the check encoding process is of utmost importance. If there is any discrepancy between the amount a check is made out for and the encoded amount, the check is defective.Twenty samples, each consisting of 250 checks, were selected and examined. The number of defective checks found in each sample is shown below.  The manager of the check encoding department knows from past experience that when the encoding process is in control, an average of 1.6% of the encoded checks are defective.
a. Determine the center line and the 3-sigma control limits for the p chart.
b. Plot the twenty recent sample findings on the chart and decide if the check encoding operation is in control.
The manager of the check encoding department knows from past experience that when the encoding process is in control, an average of 1.6% of the encoded checks are defective.
a. Determine the center line and the 3-sigma control limits for the p chart.
b. Plot the twenty recent sample findings on the chart and decide if the check encoding operation is in control.
(Essay)
4.8/5 (34)
A process sampled 30 times with a sample of size nine resulted in  = 12.7 and
  = 0.8. Compute the upper and lower control limits for the
  and
and  charts for this process.
(Essay)
4.8/5 (35)
A soft drink filling machine is set up to fill bottles with 12 ounces of soft drink. The standard deviation s is known to be 0.4 ounces. The quality control department periodically selects samples of 16 bottles and measures their contents. Assume the distribution of filling volumes is normal.
a.Determine the upper and lower control limits and explain what they indicate.
b.The means of six samples were 11.8, 12.2, 11.9, 11.9, 12.1, and 11.8 ounces. Construct an x-bar chart and indicate whether or not the process is in control.
(Essay)
4.8/5 (29)
An acceptance sampling plan with n = 20 and c = 1 has been designed with a producer's risk of .12.
a. Was the value of p0 equal to .02, .03, .04, or .05?
b. What is the consumer's risk associated with this plan if p1 is .08?
c. Assume the consumer's risk found in (b) is unacceptably high. Which modification of the sampling plan will result in the greater reduction of the consumer's risk, increasing n to 30 or decreasing c to 0?
(Essay)
4.8/5 (34)
The following data represent the filling weights based on samples of 14.5 ounce cans of whole peeled tomatoes. Ten samples of size 5 were taken. Use Excel to develop an R chart. 
(Essay)
4.8/5 (39)
Control charts based on data that can be measured on a continuous scale are called
(Multiple Choice)
4.8/5 (30)
Process control and acceptance sampling procedures are most closely related to
(Multiple Choice)
4.7/5 (36)
The following data represent the filling weights based on samples of 350-gram containers. Ten samples of size 5 were taken. Use Excel to develop an R chart. 
(Essay)
4.8/5 (35)
A process that is in control has a mean of = 56.5 and a standard deviation of = 3.4. What should the control limits be for a sample mean chart if samples of size 8 are taken?
(Short Answer)
4.7/5 (41)
A production process is considered in control if 4% of the items produced are defective. Samples of size 100 are used for the inspection process.
a.Determine the standard error of the proportion.
b.Determine the upper and the lower control limits for the p chart.
(Essay)
4.8/5 (44)
Filters
- Essay(0)
- Multiple Choice(0)
- Short Answer(0)
- True False(0)
- Matching(0)