Exam 10: Inference About Means and Proportions With Two Populations
Exam 1: Data and Statistics85 Questions
Exam 2: Descriptive Statistics: Tabular and Graphical Displays112 Questions
Exam 3: Descriptive Statistics: Numerical Measures139 Questions
Exam 4: Introduction to Probability129 Questions
Exam 5: Discrete Probability Distributions150 Questions
Exam 6: Continuous Probability Distributions144 Questions
Exam 7: Sampling and Sampling Distributions119 Questions
Exam 8: Interval Estimation118 Questions
Exam 9: Hypothesis Tests118 Questions
Exam 10: Inference About Means and Proportions With Two Populations127 Questions
Exam 11: Inferences About Population Variances113 Questions
Exam 12: Tests of Goodness of Fit, Independence and Multiple Proportions76 Questions
Exam 13: Experimental Design and Analysis of Variance125 Questions
Exam 14: Simple Linear Regression103 Questions
Exam 15: Multiple Regression109 Questions
Exam 16: Regression Analysis: Model Building82 Questions
Exam 17: Time Series Analysis and Forecasting80 Questions
Exam 18: Nonparametric Methods83 Questions
Exam 19: Statistical Methods for Quality Control75 Questions
Exam 20: Decision Analysis71 Questions
Exam 21: Sample Survey68 Questions
Select questions type
Two independent random samples of annual starting salaries for individuals with master's and bachelor's degrees in business were taken and the results are shown below  a.What are the degrees of freedom for the t distribution?
b.Provide a 95% confidence interval estimate for the difference between the salaries of the two groups.
a.What are the degrees of freedom for the t distribution?
b.Provide a 95% confidence interval estimate for the difference between the salaries of the two groups.
(Short Answer)
4.9/5  (39)
(39)
Exhibit 10-4
The following information was obtained from independent random samples.Assume normally distributed populations with equal variances.  -Refer to Exhibit 10-4. The 95% confidence interval for the difference between the two population means is
(Multiple Choice)
4.9/5 (35)
In order to estimate the difference between the average daily sales of two branches of a department store, the following data has been gathered.  a.Determine the point estimate of the difference between the means.
b.Determine the degrees of freedom for this interval estimation.
c.Compute the margin of error.
d.Develop a 95% confidence interval for the difference between the two population means.
a.Determine the point estimate of the difference between the means.
b.Determine the degrees of freedom for this interval estimation.
c.Compute the margin of error.
d.Develop a 95% confidence interval for the difference between the two population means.
(Essay)
4.9/5 (39)
A potential investor conducted a 144 day survey in each theater in order to determine the difference between the average daily attendance at the North Mall and South Mall theaters. The North Mall Theater averaged 630 patrons per day; while the South Mall Theater averaged 598 patrons per day. From past information, it is known that the variance for North Mall is 1,000; while the variance for the South Mall is 1,304. Develop a 95% confidence interval for the difference between the average daily attendance at the two theaters.
(Short Answer)
4.8/5 (36)
Exhibit 10-11
An insurance company selected samples of clients under 18 years of age and over 18 and recorded the number of accidents they had in the previous year. The results are shown below.  We are interested in determining if the accident proportions differ between the two age groups.
-Refer to Exhibit 10-11 and let pu represent the proportion under and po the proportion over the age of 18. The null hypothesis is
We are interested in determining if the accident proportions differ between the two age groups.
-Refer to Exhibit 10-11 and let pu represent the proportion under and po the proportion over the age of 18. The null hypothesis is
(Multiple Choice)
4.8/5 (49)
Exhibit 10-13
In order to determine whether or not there is a significant difference between the hourly wages of two companies, the following data have been accumulated. 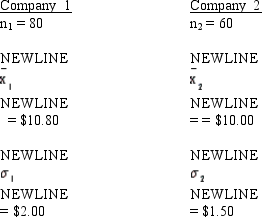 -Refer to Exhibit 10-13. The test statistic has a value of
(Multiple Choice)
4.8/5 (30)
A potential investor conducted a 49 day survey in two theaters in order to determine the difference between the average daily attendance at North Mall and South Mall Theaters. The North Mall Theater averaged 720 patrons per day with a variance of 100; while the South Mall Theater averaged 700 patrons per day with a variance of 96. Develop an interval estimate for the difference between the average daily attendance at the two theaters. Use a confidence coefficient of 0.95.
(Short Answer)
4.7/5 (38)
Exhibit 10-13
In order to determine whether or not there is a significant difference between the hourly wages of two companies, the following data have been accumulated.
-Refer to Exhibit 10-13. The null hypothesis for this test is
(Multiple Choice)
4.8/5 (34)
In a random sample of 200 Republicans, 160 opposed the new tax laws. While in a sample of 120 Democrats, 84 opposed the new tax laws. Determine a 95% confidence interval estimate for the difference between the proportions of Republicans and Democrats opposed to this new law.
(Short Answer)
4.7/5 (40)
Exhibit 10-11
An insurance company selected samples of clients under 18 years of age and over 18 and recorded the number of accidents they had in the previous year. The results are shown below. We are interested in determining if the accident proportions differ between the two age groups.
-Refer to Exhibit 10-11. The p-value is
(Multiple Choice)
4.9/5 (49)
Exhibit 10-10
The results of a recent poll on the preference of shoppers regarding two products are shown below.  -Refer to Exhibit 10-10. At 95% confidence, the margin of error is
(Multiple Choice)
5.0/5 (33)
Exhibit 10-5
The following information was obtained from matched samples.  -Refer to Exhibit 10-5. The 95% confidence interval for the difference between the two population means is
(Multiple Choice)
4.9/5 (34)
Exhibit 10-13
In order to determine whether or not there is a significant difference between the hourly wages of two companies, the following data have been accumulated.
-Refer to Exhibit 10-13. The p-value is
(Multiple Choice)
4.7/5 (40)
A survey was recently conducted to determine if consumers spend more on computer-related purchases via the Internet or store visits. Assume a sample of 8 respondents provided the following data on their computer-related purchases during a 30-day period. Using a .05 level of significance, can we conclude that consumers spend more on computer-related purchases by way of the Internet than by visiting stores? 
(Essay)
4.8/5 (39)
Exhibit 10-6
The management of a department store is interested in estimating the difference between the mean credit purchases of customers using the store's credit card versus those customers using a national major credit card. You are given the following information.  -Refer to Exhibit 10-6. A point estimate for the difference between the mean purchases of the users of the two credit cards is
(Multiple Choice)
4.7/5 (39)
Exhibit 10-10
The results of a recent poll on the preference of shoppers regarding two products are shown below.
-Refer to Exhibit 10-10. The standard error of  is
is
(Multiple Choice)
4.9/5 (35)
Independent random samples taken at two local malls provided the following information regarding purchases by patrons of the two malls.  We want to determine whether or not there is a significant difference between the average purchases by the patrons of the two malls.
a.Give the hypotheses for the above.
b.Compute the test statistic.
c.At 95% confidence, test the hypotheses.
We want to determine whether or not there is a significant difference between the average purchases by the patrons of the two malls.
a.Give the hypotheses for the above.
b.Compute the test statistic.
c.At 95% confidence, test the hypotheses.
(Essay)
4.8/5 (35)
In order to estimate the difference between the average Miles per Gallon of two different models of automobiles, samples are taken and the following information is collected.  a.At 95% confidence develop an interval estimate for the difference between the average Miles per Gallon for the two models.
b.Is there conclusive evidence to indicate that one model gets a higher MPG than the other? Why or why not? Explain.
a.At 95% confidence develop an interval estimate for the difference between the average Miles per Gallon for the two models.
b.Is there conclusive evidence to indicate that one model gets a higher MPG than the other? Why or why not? Explain.
(Essay)
4.9/5 (44)
Test scores on a standardized test from samples of students from two universities are given below.  Provide a 98% confidence interval estimate for the difference between the test scores of the two universities.
(Short Answer)
4.8/5 (39)
Consider the following results for two samples randomly taken from two populations.  a.Determine the degrees of freedom for the t-distribution.
b.Develop a 95% confidence interval for the difference between the two population means.
a.Determine the degrees of freedom for the t-distribution.
b.Develop a 95% confidence interval for the difference between the two population means.
(Short Answer)
4.9/5 (41)
Filters
- Essay(0)
- Multiple Choice(0)
- Short Answer(0)
- True False(0)
- Matching(0)