Exam 8: Regression Wisdom
Exam 1: Stats Starts Here33 Questions
Exam 2: Displaying and Describing Categorical Data70 Questions
Exam 3: Displaying and Summarizing Quantitative Data148 Questions
Exam 4: Understanding and Comparing Distributions46 Questions
Exam 5: The Standard Deviation As a Ruler and the Normal Model111 Questions
Exam 6: Scatterplots, association, and Correlation78 Questions
Exam 7: Linear Regression71 Questions
Exam 8: Regression Wisdom32 Questions
Exam 9: Understanding Randomness26 Questions
Exam 10: Sample Surveys64 Questions
Exam 11: Experiments and Observational Studies80 Questions
Exam 12: From Randomness to Probability69 Questions
Exam 13: Probability Rules95 Questions
Exam 14: Random Variables215 Questions
Exam 15: Sampling Distribution Models51 Questions
Exam 16: Confidence Intervals for Proportions71 Questions
Exam 17: Testing Hypotheses About Proportions44 Questions
Exam 18: More About Tests67 Questions
Exam 19: Comparing Two Proportions53 Questions
Exam 20: Inferences About Means123 Questions
Exam 21: Comparing Means50 Questions
Exam 22: Paired Samples and Blocks35 Questions
Exam 23: Comparing Counts76 Questions
Exam 24: Inferences for Regression57 Questions
Exam 25: Analysis of Variance39 Questions
Exam 26: Multifactor Analysis of Variance22 Questions
Exam 27: Multiple Regression22 Questions
Exam 28: Multiple Regression Wisdom21 Questions
Exam 29: Rank-Based Nonparametric Tests29 Questions
Exam 30: The Bootstrap27 Questions
Select questions type
The figure below shows the association between life expectancy and infant mortality for several different countries.Also shown is the equation and correlation from a regression analysis.What is the correct conclusion to draw from the figure? 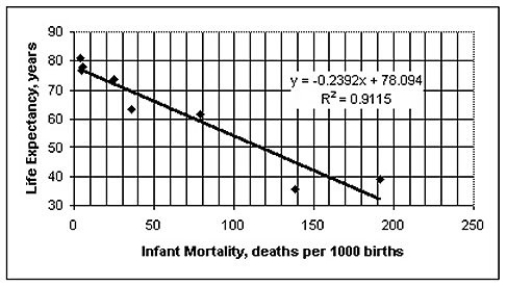
(Multiple Choice)
4.8/5  (39)
(39)
The figure below examines the association between life expectancy and computer ownership for several countries.Also shown are the equation and R2 value from a linear regression analysis.What is the best conclusion to draw from the figure? 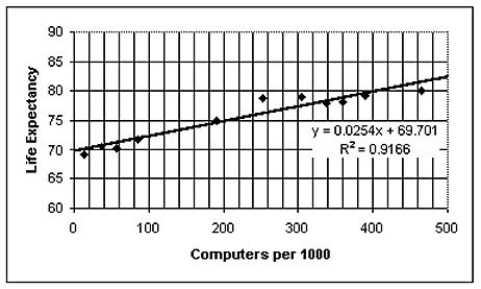
(Multiple Choice)
4.8/5 (39)
The table below displays the latitude (degrees north)and average daily minimum temperature in January (in degrees Fahrenheit)for some cities located in the northern hemisphere. Latitude (Deg North)Average Daily Min Temp in Jan (°F)
Athens,Greece 38 42
Mumbai,India 19 62
Cairo,Egypt 30 47
London,England 51 35
Mexico City,Mexico 19 42
Moscow,Russia 55 9
Paris,France 49 32
Bangkok,Thailand 13 67
Tokyo,Japan 35 29
Manila,Philippines 14 69
The scatter plot and regression equation are shown below: 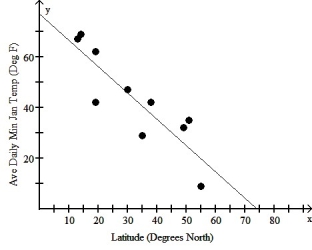 The regression analysis of this data yields the following values: Variable Coefficient Constant 76.94 Latitude 1.038 R2 = 0.7660
Use this model to predict the average daily minimum temperature in January for Panama City whose latitude is 9 degrees north.
The regression analysis of this data yields the following values: Variable Coefficient Constant 76.94 Latitude 1.038 R2 = 0.7660
Use this model to predict the average daily minimum temperature in January for Panama City whose latitude is 9 degrees north.
(Multiple Choice)
4.9/5 (33)
Which of the following scatterplots of residuals suggests that a linear model may not be applicable?
I 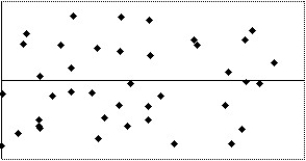 II
II 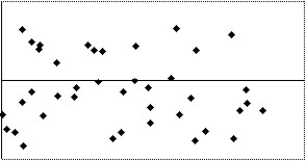 III
III 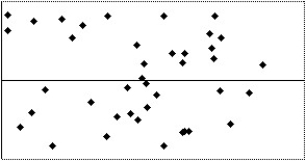 IV
IV 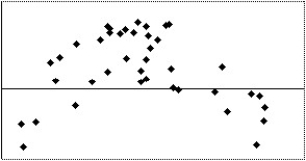
(Multiple Choice)
5.0/5 (30)
Which of the labeled points below will exert the largest leverage on a linear model of the data? 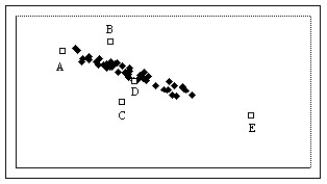
(Multiple Choice)
4.9/5 (37)
A university studied students' grades and established a strong positive association between the high school average of incoming students and their university GPA.Describe three different possible cause-and-effect relationships that might be present.
(Multiple Choice)
4.9/5 (30)
The table below shows the gestation (in days)and average longevity (in years)for a number of different mammals: Gestation (days) Average Longevity (years) Black Bear 219 18 Cat (domestic) 63 12 Monkey (Rhesus) 166 15 Lion 100 15 Horse 330 20 Gorilla 258 20 Gray Squirrel 44 10 The scatter plot and regression equation are shown below: 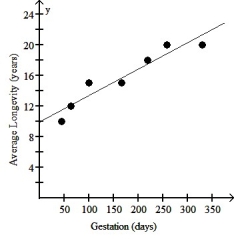 The regression analysis of this data yields the following values: Variable Coefficient Constant 9.90 Gestation 0.0345 R2 = 0.9048 Use this model to predict the average longevity of an African elephant whose gestation is 660 days.
(Multiple Choice)
4.8/5 (37)
Over a period of years,a certain town observed the association between the number of people attending churches and the number of people in the city jail.The results are shown on the figure below.Also shown are the equation and R2 value from a linear regression analysis.What is the best conclusion to draw from the figure? 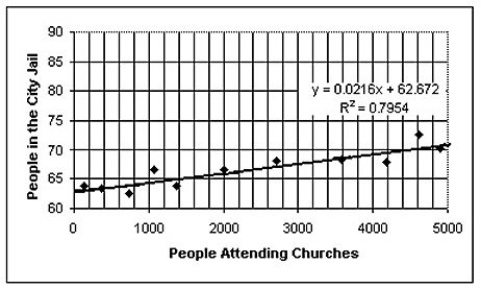
(Multiple Choice)
4.9/5 (44)
The total home-game attendance for major-league baseball is the sum of all attendees for all stadiums during the entire season.The home attendance (in millions)for a number of years is shown in the table below. Year Home Attendance (millions) 1978 40.6 1979 43.5 1980 43.0 1981 26.6 1982 44.6 1983 46.3 1984 48.7 1985 49.0 1986 50.5 1987 51.8 1988 53.2 a)Make a scatterplot showing the trend in home attendance.Describe what you see. 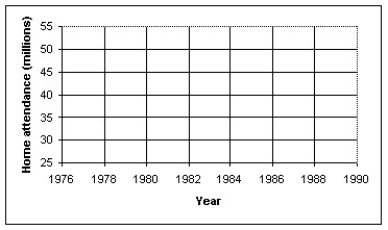 b)Determine the correlation,and comment on its significance.
c)Find the equation of the line of regression.Interpret the slope of the equation.
d)Use your model to predict the home attendance for 1998.How much confidence do you have in this prediction? Explain.
e)Use the internet or other resource to find reasons for any outliers you observe in the scatterplot.
b)Determine the correlation,and comment on its significance.
c)Find the equation of the line of regression.Interpret the slope of the equation.
d)Use your model to predict the home attendance for 1998.How much confidence do you have in this prediction? Explain.
e)Use the internet or other resource to find reasons for any outliers you observe in the scatterplot.
(Essay)
4.8/5 (38)
Which of the labeled points below will exert the largest leverage on a linear model of the data? 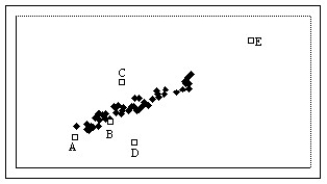
(Multiple Choice)
4.8/5 (42)
Filters
- Essay(0)
- Multiple Choice(0)
- Short Answer(0)
- True False(0)
- Matching(0)