Exam 14: Multiple Regression
Exam 1: An Introduction to Business Statistics54 Questions
Exam 2: Descriptive Statistics: Tabular and Graphical Methods90 Questions
Exam 3: Descriptive Statistics: Numerical Methods149 Questions
Exam 4: Probability135 Questions
Exam 5: Discrete Random Variables128 Questions
Exam 6: Continuous Random Variables150 Questions
Exam 7: Sampling and Sampling Distributions116 Questions
Exam 8: Confidence Intervals144 Questions
Exam 9: Hypothesis Testing148 Questions
Exam 10: Statistical Inferences Based on Two Samples132 Questions
Exam 11: Experimental Design and Analysis of Variance115 Questions
Exam 12: Chi-Square Tests96 Questions
Exam 13: Simple Linear Regression Analysis148 Questions
Exam 14: Multiple Regression122 Questions
Exam 15: Model Building and Model Diagnostics102 Questions
Exam 16: Time Series Forecasting150 Questions
Exam 17: Process Improvement Using Control Charts122 Questions
Exam 18: Nonparametric Methods97 Questions
Exam 19: Decision Theory90 Questions
Select questions type
Below is a partial multiple regression ANOVA table. 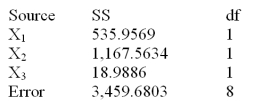 What is the mean square error?
(Essay)
4.8/5  (38)
(38)
The management of a professional baseball team is in the process of determining the budget for next year.A major component of future revenue is attendance at the home games.In order to predict attendance at home games the team statistician has used a multiple regression model with dummy variables.The model is of the form: y = 0 + 1x1 + 2x2 + 3x3 + where:
Y = attendance at a home game
x1 = current power rating of the team on a scale from 0 to 100 before the game.
x2 and x3 are dummy variables,and they are defined below.
x2 = 1,if weekend
x2= 0,otherwise
x3= 1,if weather is favorable
x3= 0,otherwise
After collecting the data based on 30 games from last year,and implementing the above stated multiple regression model,the team statistician obtained the following least squares multiple regression equation:  The multiple regression compute output also indicated the following:
  Assume that the overall model is useful in predicting the game attendance.Assume today is Wednesday morning and the weather forecast indicates sunny,excellent weather conditions for the rest of the day.Later today,there is a home baseball game for this team.Assume that the current power rating of the team is 85 and predict the attendance for today's game.
(Essay)
4.8/5 (38)
The manufacturer of a light fixture believes that the dollars spent on advertising,the price of the fixture and the number of retail stores selling the fixture in a particular month,influence the light fixture sales.The manufacturer randomly selects 10 months and collects the following data: 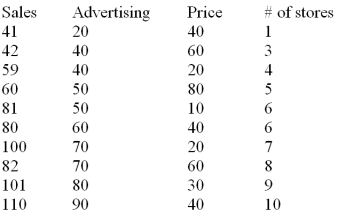 The sales are in thousands of units per month,the advertising is given in hundreds of dollars per month,and the price is the unit retail price for the particular month.Using MINITAB the following computer output is obtained.
The regression equation is
Sales = 31.0 + 0.820 Advertising - 0.325 Price + 1.84 Stores
The sales are in thousands of units per month,the advertising is given in hundreds of dollars per month,and the price is the unit retail price for the particular month.Using MINITAB the following computer output is obtained.
The regression equation is
Sales = 31.0 + 0.820 Advertising - 0.325 Price + 1.84 Stores 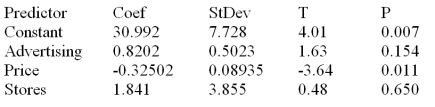 S = 5.465 R - Sq = 96.7% R - Sq(adj)= 95.0%
Analysis of Variance
S = 5.465 R - Sq = 96.7% R - Sq(adj)= 95.0%
Analysis of Variance  Based on the multiple regression model given above,the point estimate of the monthly light fixture sales corresponding to second sample data is 49.82 or 49,820 units.This point estimate is calculated based on the assumption that the company spends $4000 on advertising,the price of the fixture is $60 and the fixture is being sold at 3 retail stores.Additional information related to this point estimate is given below.
  Calculate the 95% prediction interval for this point estimate.
(Essay)
5.0/5 (40)
Consider the following analysis of variance table from a multiple regression model.Test the model for overall usefulness at  = .01 and carefully make a managerial conclusion.
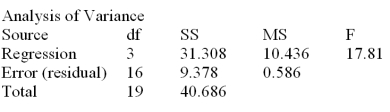
(Essay)
4.7/5 (37)
Below is a partial multiple regression computer output.  Test the usefulness of variable x5 in the model at = .05.Calculate the t statistic and state your conclusions.
(Essay)
4.9/5 (35)
Below is a partial multiple regression ANOVA table. 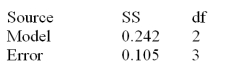 Calculate the adjusted R2.
(Essay)
4.8/5 (33)
Below is a partial multiple regression ANOVA table. 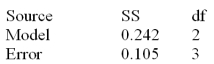 What is the total sum of squares,explained variation,mean square error and the number of observations in the sample?
(Essay)
4.9/5 (41)
Below is a partial multiple regression ANOVA table. 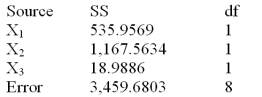 Calculate the explained variation.
(Essay)
4.7/5 (38)
The multiple _________ measures the proportion of the variation in y (response variable)explained by the multiple regression model or the set of independent variables included in the multiple regression equation.
(Multiple Choice)
4.7/5 (43)
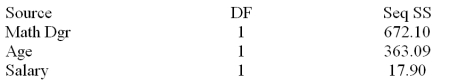
A member of the state legislature has expressed concern about the differences in the mathematics test scores of high school freshmen across the state.She asks her research assistant to conduct a study to investigate what factors could account for the differences.The research assistant looked at a random sample of school districts across the state and used the factors of percentage of mathematics teachers in each district with a degree in mathematics,the average age of mathematics teachers and the average salary of mathematics teachers 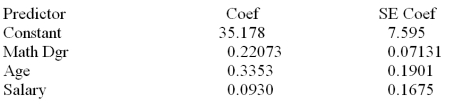 s = 7.62090
Analysis of Variance
s = 7.62090
Analysis of Variance 
 Test the usefulness of variable x1 in the model at = .05.Calculate the t statistic and state your conclusions.
(Essay)
4.8/5 (42)
The manufacturer of a light fixture believes that the dollars spent on advertising,the price of the fixture,and the number of retail stores selling the fixture in a particular month,influence the light fixture sales.The manufacturer randomly selects 10 months and collects the following data:  The sales are in thousands of units per month,the advertising is given in hundreds of dollars per month,and the price is the unit retail price for the particular month.Using MINITAB the following computer output is obtained.
The regression equation is
Sales = 31.0 + 0.820 Advertising - 0.325 Price + 1.84 Stores
The sales are in thousands of units per month,the advertising is given in hundreds of dollars per month,and the price is the unit retail price for the particular month.Using MINITAB the following computer output is obtained.
The regression equation is
Sales = 31.0 + 0.820 Advertising - 0.325 Price + 1.84 Stores  S = 5.465 R - Sq = 96.7% R - Sq(adj)= 95.0%
Analysis of Variance
S = 5.465 R - Sq = 96.7% R - Sq(adj)= 95.0%
Analysis of Variance 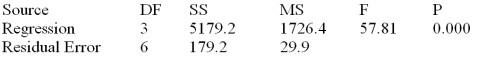 Based on the multiple regression model given above,the point estimate of the monthly light fixture sales corresponding to second sample data is 49.82 or 49,820 units.This point estimate is calculated based on the assumption that the company spends $4000 on advertising,the price of the fixture is $60 and the fixture is being sold at 3 retail stores.Additional information related to this point estimate is given below.
  Test the usefulness of variable "price" in the model using the null hypothesis H0: 2 0,at = 0.05,and state your conclusions.
(Essay)
4.9/5 (32)
In multiple regression analysis,which one of the following is the appropriate notation for error (residual)?
(Multiple Choice)
4.8/5 (39)
A(n)________ plot is a residual plot that is used for the purpose of checking the normality assumption of the multiple regression model.
(Multiple Choice)
4.9/5 (37)
The manufacturer of a light fixture believes that the dollars spent on advertising,the price of the fixture,and the number of retail stores selling the fixture in a particular month,influence the light fixture sales.The manufacturer randomly selects 10 months and collects the following data:  The sales are in thousands of units per month,the advertising is given in hundreds of dollars per month,and the price is the unit retail price for the particular month.Using MINITAB,the following computer output is obtained.
The regression equation is
Sales = 31.0 + 0.820 Advertising - 0.325 Price + 1.84 Stores
The sales are in thousands of units per month,the advertising is given in hundreds of dollars per month,and the price is the unit retail price for the particular month.Using MINITAB,the following computer output is obtained.
The regression equation is
Sales = 31.0 + 0.820 Advertising - 0.325 Price + 1.84 Stores  S = 5.465 R - Sq = 96.7% R - Sq(adj)= 95.0%
Analysis of Variance
S = 5.465 R - Sq = 96.7% R - Sq(adj)= 95.0%
Analysis of Variance 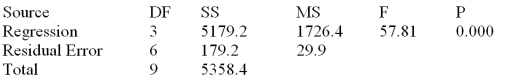 Interpret the regression coefficients for the variables advertising,price and store.
(Essay)
4.8/5 (38)
Below is a partial multiple regression computer output. 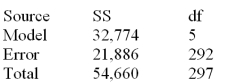 Test the overall usefulness of the model at
  = .01.Calculate the F statistic and make your decision.
(Essay)
4.8/5 (37)
Assumptions of a regression model can be evaluated by plotting and analyzing the _________.
(Multiple Choice)
4.9/5 (28)
A member of the state legislature has expressed concern about the differences in the mathematics test scores of high school freshmen across the state.She asks her research assistant to conduct a study to investigate what factors could account for the differences.The research assistant looked at a random sample of school districts across the state and used the factors of percentage of mathematics teachers in each district with a degree in mathematics,the average age of mathematics teachers and the average salary of mathematics teachers  s = 7.62090
Analysis of Variance
s = 7.62090
Analysis of Variance 
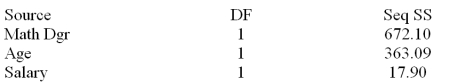 Based on the multiple regression model given above,estimate the mathematics test score and calculate the value of the residual,if the percentage of teachers with a mathematics degree is 50.0,the average age is 43 and the average salary is 48,300 (48.3).The actual mathematics test score for these factors is 68.50.
(Essay)
4.9/5 (36)
The manufacturer of a light fixture believes that the dollars spent on advertising,the price of the fixture,and the number of retail stores selling the fixture in a particular month,influence the light fixture sales.The manufacturer randomly selects 10 months and collects the following data: 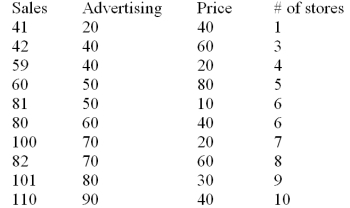 The sales are in thousands of units per month,the advertising is given in hundreds of dollars per month,and the price is the unit retail price for the particular month.Using MINITAB,the following computer output is obtained.
The regression equation is
Sales = 31.0 + 0.820 Advertising - 0.325 Price + 1.84 Stores
The sales are in thousands of units per month,the advertising is given in hundreds of dollars per month,and the price is the unit retail price for the particular month.Using MINITAB,the following computer output is obtained.
The regression equation is
Sales = 31.0 + 0.820 Advertising - 0.325 Price + 1.84 Stores  S = 5.465 R - Sq = 96.7% R - Sq(adj)= 95.0%
Analysis of Variance
S = 5.465 R - Sq = 96.7% R - Sq(adj)= 95.0%
Analysis of Variance  Based on the multiple regression model given above,the point estimate of the monthly light fixture sales corresponding to second sample data is 49.82 or 49,820 units.This point estimate is calculated based on the assumption that the company spends $4000 on advertising,the price of the fixture is $60 and the fixture is being sold at 3 retail stores.Additional information related to this point estimate is given below.
  Determine the 95% interval for 1 (beta coefficient for the advertising variable).
(Essay)
4.9/5 (43)
Consider the following partial computer output for a multiple regression model. 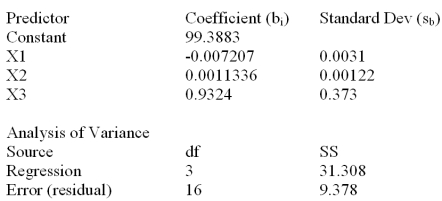 Test the overall usefulness of the model at = .01.Calculate F and make your decision.
(Essay)
4.9/5 (43)
Filters
- Essay(0)
- Multiple Choice(0)
- Short Answer(0)
- True False(0)
- Matching(0)