Exam 14: Multiple Regression
Exam 1: An Introduction to Business Statistics54 Questions
Exam 2: Descriptive Statistics: Tabular and Graphical Methods90 Questions
Exam 3: Descriptive Statistics: Numerical Methods149 Questions
Exam 4: Probability135 Questions
Exam 5: Discrete Random Variables128 Questions
Exam 6: Continuous Random Variables150 Questions
Exam 7: Sampling and Sampling Distributions116 Questions
Exam 8: Confidence Intervals144 Questions
Exam 9: Hypothesis Testing148 Questions
Exam 10: Statistical Inferences Based on Two Samples132 Questions
Exam 11: Experimental Design and Analysis of Variance115 Questions
Exam 12: Chi-Square Tests96 Questions
Exam 13: Simple Linear Regression Analysis148 Questions
Exam 14: Multiple Regression122 Questions
Exam 15: Model Building and Model Diagnostics102 Questions
Exam 16: Time Series Forecasting150 Questions
Exam 17: Process Improvement Using Control Charts122 Questions
Exam 18: Nonparametric Methods97 Questions
Exam 19: Decision Theory90 Questions
Select questions type
Consider the following partial computer output for a multiple regression model. 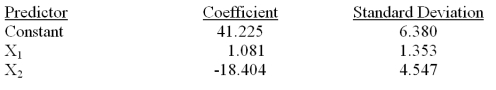 Analysis of Variance
 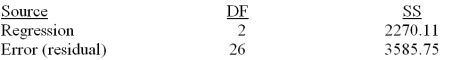 What is the total sum of squares?
(Essay)
4.9/5  (40)
(40)
The graph of the prediction equation obtained from the model 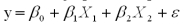 is a(n)
(Multiple Choice)
4.8/5 (32)
The manufacturer of a light fixture believes that the dollars spent on advertising,the price of the fixture and the number of retail stores selling the fixture in a particular month,influence the light fixture sales.The manufacturer randomly selects 10 months and collects the following data: 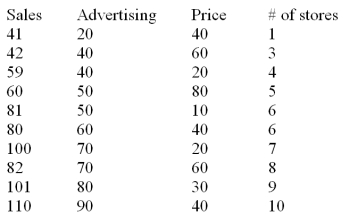 The sales are in thousands of units per month,the advertising is given in hundreds of dollars per month,and the price is the unit retail price for the particular month.Using MINITAB the following computer output is obtained.
The regression equation is
Sales = 31.0 + 0.820 Advertising - 0.325 Price + 1.84 Stores
The sales are in thousands of units per month,the advertising is given in hundreds of dollars per month,and the price is the unit retail price for the particular month.Using MINITAB the following computer output is obtained.
The regression equation is
Sales = 31.0 + 0.820 Advertising - 0.325 Price + 1.84 Stores 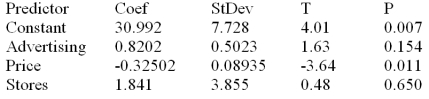 S = 5.465 R - Sq = 96.7% R - Sq(adj)= 95.0%
Analysis of Variance
S = 5.465 R - Sq = 96.7% R - Sq(adj)= 95.0%
Analysis of Variance 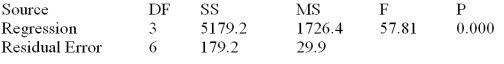 Based on the multiple regression model given above,the point estimate of the monthly light fixture sales corresponding to second sample data is 49.82 or 49,820 units.This point estimate is calculated based on the assumption that the company spends $4000 on advertising,the price of the fixture is $60 and the fixture is being sold at 3 retail stores.Additional information related to this point estimate is given below.
  Determine the 95% confidence interval for this point estimate and interpret its meaning.
(Essay)
4.8/5 (39)
Consider the following partial computer output for a multiple regression model. 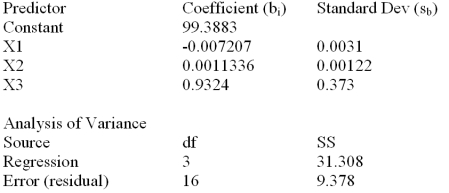 Calculate R2.
(Essay)
4.9/5 (39)
An investigator hired by a client suing for sex discrimination has developed a multiple regression model for employee salaries for the company in question.In this multiple regression model,the salaries are in thousands of dollars.For example,a data entry of 35 for the dependent variable indicates a salary of $35,000.The indicator (dummy)variable for gender is coded as X1 = 0 if male and X1 = 1 if female.The computer output of this multiple regression model shows that the coefficient for this variable (X1)is - 4.2.The t test showed that X1 was significant at = 0.1.This result implies that for male and female workers of the company,
(Multiple Choice)
4.8/5 (36)
A member of the state legislature has expressed concern about the differences in the mathematics test scores of high school freshmen across the state.She asks her research assistant to conduct a study to investigate what factors could account for the differences.The research assistant looked at a random sample of school districts across the state and used the factors of percentage of mathematics teachers in each district with a degree in mathematics,the average age of mathematics teachers and the average salary of mathematics teachers 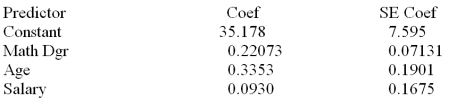 s = 7.62090
Analysis of Variance
s = 7.62090
Analysis of Variance 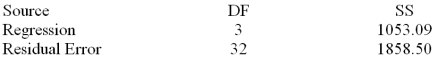
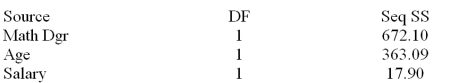 Determine the 90% interval for 2 and interpret its meaning
(Essay)
4.7/5 (40)
A member of the state legislature has expressed concern about the differences in the mathematics test scores of high school freshmen across the state.She asks her research assistant to conduct a study to investigate what factors could account for the differences.The research assistant looked at a random sample of school districts across the state and used the factors of percentage of mathematics teachers in each district with a degree in mathematics,the average age of mathematics teachers and the average salary of mathematics teachers 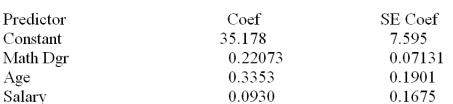 s = 7.62090
Analysis of Variance
s = 7.62090
Analysis of Variance 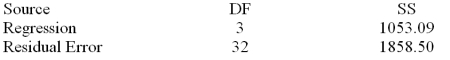
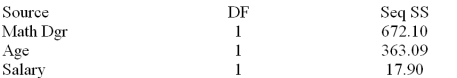 Test the overall usefulness of the model at = .01.Calculate F and make your decision.
(Essay)
4.9/5 (39)
The range of feasible values for the multiple coefficient of determination is from:
(Multiple Choice)
4.9/5 (40)
_____ variation is the sum of explained variation plus the sum of unexplained variation.
(Multiple Choice)
4.7/5 (26)
In multiple regression analysis,the mean square regression divided by mean square error yields the:
(Multiple Choice)
4.8/5 (27)
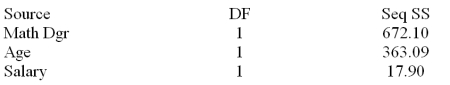
Below is a partial multiple regression ANOVA table. 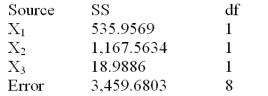 Calculate the proportion of the variation explained by the multiple regression model.
(Essay)
4.7/5 (38)
A member of the state legislature has expressed concern about the differences in the mathematics test scores of high school freshmen across the state.She asks her research assistant to conduct a study to investigate what factors could account for the differences.The research assistant looked at a random sample of school districts across the state and used the factors of percentage of mathematics teachers in each district with a degree in mathematics,the average age of mathematics teachers and the average salary of mathematics teachers 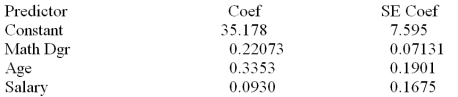 s = 7.62090
Analysis of Variance
s = 7.62090
Analysis of Variance 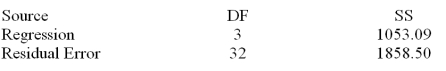
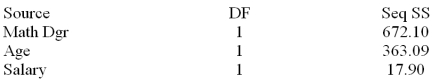 What is the explained variation?
(Essay)
4.9/5 (39)
The manufacturer of a light fixture believes that the dollars spent on advertising,the price of the fixture,and the number of retail stores selling the fixture in a particular month,influence the light fixture sales.The manufacturer randomly selects 10 months and collects the following data: 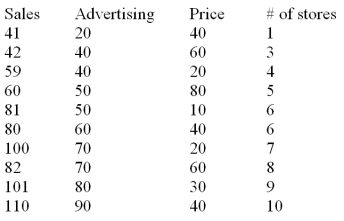 The sales are in thousands of units per month,the advertising is given in hundreds of dollars per month,and the price is the unit retail price for the particular month.Using MINITAB the following computer output is obtained.
The regression equation is
Sales = 31.0 + 0.820 Advertising - 0.325 Price + 1.84 Stores
The sales are in thousands of units per month,the advertising is given in hundreds of dollars per month,and the price is the unit retail price for the particular month.Using MINITAB the following computer output is obtained.
The regression equation is
Sales = 31.0 + 0.820 Advertising - 0.325 Price + 1.84 Stores 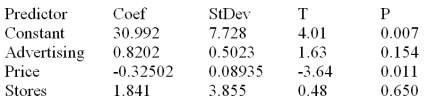 S = 5.465v R - Sq = 96.7% R - Sq(adj)= 95.0%
Analysis of Variance
S = 5.465v R - Sq = 96.7% R - Sq(adj)= 95.0%
Analysis of Variance 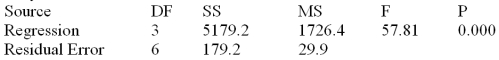 Based on the multiple regression model given above,the point estimate of the monthly light fixture sales corresponding to second sample data is 49.82 or 49,820 units.This point estimate is calculated based on the assumption that the company spends $4000 on advertising,the price of the fixture is $60 and the fixture is being sold at 3 retail stores.Additional information related to this point estimate is given below.
  The 95% prediction interval for the point estimate given above is from 33.9 to 65.74.Interpret the meaning of this interval.
(Essay)
4.8/5 (43)
If it is desired to include marital status in a multiple regression model by using the categories: single,married,separated,divorced,widowed,what will be the effect on the model?
(Multiple Choice)
4.8/5 (36)
A member of the state legislature has expressed concern about the differences in the mathematics test scores of high school freshmen across the state.She asks her research assistant to conduct a study to investigate what factors could account for the differences.The research assistant looked at a random sample of school districts across the state and used the factors of percentage of mathematics teachers in each district with a degree in mathematics,the average age of mathematics teachers and the average salary of mathematics teachers 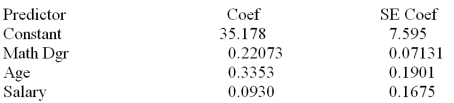 s = 7.62090
Analysis of Variance
s = 7.62090
Analysis of Variance 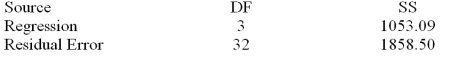
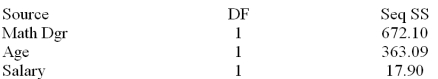 Calculate the adjusted R2.
(Essay)
4.8/5 (41)
A particular multiple regression model has 3 independent variables,the sum of the squared error is 7680,and the total number of observations is 34.What is the value of the standard error of estimate?
(Multiple Choice)
4.8/5 (38)
Consider the following partial computer output for a multiple regression model. 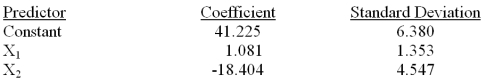 Analysis of Variance
 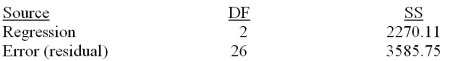 What is the mean square error?
(Essay)
4.9/5 (43)
The difference between the observed values of y and the predicted value of y is referred to as a/an _____.
(Multiple Choice)
4.8/5 (32)
A member of the state legislature has expressed concern about the differences in the mathematics test scores of high school freshmen across the state.She asks her research assistant to conduct a study to investigate what factors could account for the differences.The research assistant looked at a random sample of school districts across the state and used the factors of percentage of mathematics teachers in each district with a degree in mathematics,the average age of mathematics teachers and the average salary of mathematics teachers 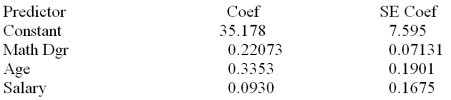 s = 7.62090
Analysis of Variance
s = 7.62090
Analysis of Variance 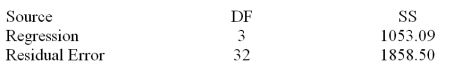
 Additional information related to this point estimate of 65.12 is given below.
Predicted Values for New Observations
50% with math degree,average age of 43 and average salary is 48.3
New
Additional information related to this point estimate of 65.12 is given below.
Predicted Values for New Observations
50% with math degree,average age of 43 and average salary is 48.3
New 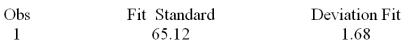 Calculate the 95% prediction interval for this point estimate.
(Essay)
4.8/5 (36)
Filters
- Essay(0)
- Multiple Choice(0)
- Short Answer(0)
- True False(0)
- Matching(0)