Exam 14: Multiple Regression
Exam 1: An Introduction to Business Statistics54 Questions
Exam 2: Descriptive Statistics: Tabular and Graphical Methods90 Questions
Exam 3: Descriptive Statistics: Numerical Methods149 Questions
Exam 4: Probability135 Questions
Exam 5: Discrete Random Variables128 Questions
Exam 6: Continuous Random Variables150 Questions
Exam 7: Sampling and Sampling Distributions116 Questions
Exam 8: Confidence Intervals144 Questions
Exam 9: Hypothesis Testing148 Questions
Exam 10: Statistical Inferences Based on Two Samples132 Questions
Exam 11: Experimental Design and Analysis of Variance115 Questions
Exam 12: Chi-Square Tests96 Questions
Exam 13: Simple Linear Regression Analysis148 Questions
Exam 14: Multiple Regression122 Questions
Exam 15: Model Building and Model Diagnostics102 Questions
Exam 16: Time Series Forecasting150 Questions
Exam 17: Process Improvement Using Control Charts122 Questions
Exam 18: Nonparametric Methods97 Questions
Exam 19: Decision Theory90 Questions
Select questions type
In a multiple regression analysis,if the normal probability plot ____________,then it can be concluded that the assumption of normality is not violated.
(Multiple Choice)
4.7/5  (34)
(34)
In multiple regression analysis,the explained sum of squares divided by the total sum of squares yields the:
(Multiple Choice)
4.9/5 (38)
The assumption of independent error terms in regression analysis is often violated when using time series data.
(True/False)
4.8/5 (35)
In a multiple regression model,a point estimate of 2 is called the ________________ error.
(Multiple Choice)
4.8/5 (33)
A multiple regression model with four independent variables consists of 29 observations.Multiple coefficient of determination,R2 = .80 and the standard error,s = 2.0.Complete the analysis of variance table for this model and test the overall model for significance.
(Essay)
4.9/5 (31)
Testing the contribution of individual independent variables with t-tests is performed prior to the F-test for the model in multiple regression analysis.
(True/False)
4.9/5 (37)
In multiple regression analysis,a desirable residual plot has what type of appearance?
(Multiple Choice)
4.8/5 (35)
The multiple correlation coefficient can assume any value between zero and 1,inclusive.
(True/False)
4.8/5 (37)
Which one of the following tools is not used to check the normality of residuals assumption for a multiple regression model?
(Multiple Choice)
4.9/5 (39)
The management of a professional baseball team is in the process of determining the budget for next year.A major component of future revenue is attendance at the home games.In order to predict attendance at home games the team statistician has used a multiple regression model with dummy variables.The model is of the form: y = 0 + 1x1 + 2x2 + 3x3 + where:
Y = attendance at a home game
x1 = current power rating of the team on a scale from 0 to 100 before the game.
x2 and x3 are dummy variables,and they are defined below.
x2 = 1,if weekend
x2= 0,otherwise
x3= 1,if weather is favorable
x3= 0,otherwise
After collecting the data based on 30 games from last year,and implementing the above stated multiple regression model,the team statistician obtained the following least squares multiple regression equation:  The multiple regression compute output also indicated the following:
  Interpret the estimated model coefficient b1
(Essay)
4.8/5 (30)
When the F test is used to test the overall significance of a multiple regression model,if the null hypothesis is rejected,it can be concluded that all of the independent variables x1,x2,.....xk are significantly related to the dependent variable y.
(True/False)
4.7/5 (44)
When using a multiple regression model,we assume that error terms (residuals)are distributed according to a(n)________________ distribution.
(Multiple Choice)
4.8/5 (51)
In a regression model,at any given combination of values of the independent variables,the population of potential error terms is assumed to have an F-distribution.
(True/False)
4.9/5 (42)
The management of a professional baseball team is in the process of determining the budget for next year.A major component of future revenue is attendance at the home games.In order to predict attendance at home games the team statistician has used a multiple regression model with dummy variables.The model is of the form: y = 0 + 1x1 + 2x2 + 3x3 + where:
Y = attendance at a home game
x1 = current power rating of the team on a scale from 0 to 100 before the game.
x2 and x3 are dummy variables,and they are defined below.
x2 = 1,if weekend
x2= 0,otherwise
x3= 1,if weather is favorable
x3= 0,otherwise
After collecting the data based on 30 games from last year,and implementing the above stated multiple regression model,the team statistician obtained the following least squares multiple regression equation: 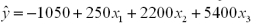 The multiple regression compute output also indicated the following:
 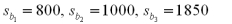 Interpret the estimated model coefficient b2.
(Essay)
4.9/5 (44)
The management of a professional baseball team is in the process of determining the budget for next year.A major component of future revenue is attendance at the home games.In order to predict attendance at home games the team statistician has used a multiple regression model with dummy variables.The model is of the form: y = 0 + 1x1 + 2x2 + 3x3 + where:
Y = attendance at a home game
x1 = current power rating of the team on a scale from 0 to 100 before the game.
x2 and x3 are dummy variables,and they are defined below.
x2 = 1,if weekend
x2= 0,otherwise
x3= 1,if weather is favorable
x3= 0,otherwise
After collecting the data based on 30 games from last year,and implementing the above stated multiple regression model,the team statistician obtained the following least squares multiple regression equation:  The multiple regression compute output also indicated the following:
 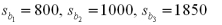 Assume that the overall model is useful in predicting the game attendance and the team statistician wants to know if the mean attendance is higher on the weekends as compared to the weekdays.State the appropriate null and alternative hypotheses.
(Essay)
4.9/5 (38)
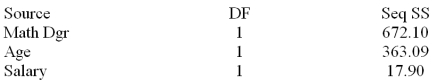
A member of the state legislature has expressed concern about the differences in the mathematics test scores of high school freshmen across the state.She asks her research assistant to conduct a study to investigate what factors could account for the differences.The research assistant looked at a random sample of school districts across the state and used the factors of percentage of mathematics teachers in each district with a degree in mathematics,the average age of mathematics teachers and the average salary of mathematics teachers 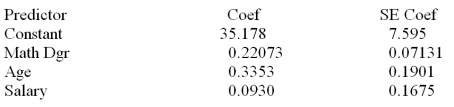 s = 7.62090
Analysis of Variance
s = 7.62090
Analysis of Variance 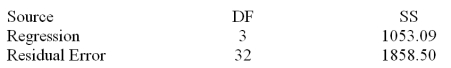
 What is the total sum of squares?
(Essay)
4.8/5 (39)
The range of feasible values for the multiple coefficient of correlation is from:
(Multiple Choice)
4.8/5 (32)
Consider the following partial computer output for a multiple regression model. 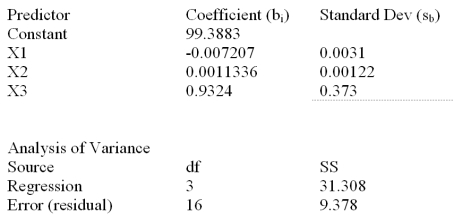 What is the total sum of squares,explained variation,and mean square error?
(Essay)
4.9/5 (35)
A member of the state legislature has expressed concern about the differences in the mathematics test scores of high school freshmen across the state.She asks her research assistant to conduct a study to investigate what factors could account for the differences.The research assistant looked at a random sample of school districts across the state and used the factors of percentage of mathematics teachers in each district with a degree in mathematics,the average age of mathematics teachers and the average salary of mathematics teachers 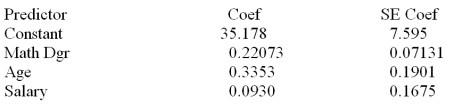 s = 7.62090
Analysis of Variance
s = 7.62090
Analysis of Variance 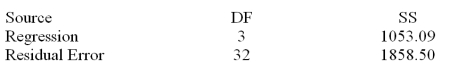
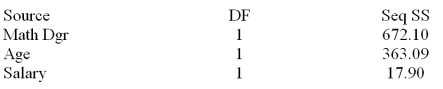 Write the least squares prediction equation.
(Essay)
4.9/5 (40)
Filters
- Essay(0)
- Multiple Choice(0)
- Short Answer(0)
- True False(0)
- Matching(0)