Exam 13: Simple Linear Regression Analysis
Exam 1: An Introduction to Business Statistics54 Questions
Exam 2: Descriptive Statistics: Tabular and Graphical Methods90 Questions
Exam 3: Descriptive Statistics: Numerical Methods149 Questions
Exam 4: Probability135 Questions
Exam 5: Discrete Random Variables128 Questions
Exam 6: Continuous Random Variables150 Questions
Exam 7: Sampling and Sampling Distributions116 Questions
Exam 8: Confidence Intervals144 Questions
Exam 9: Hypothesis Testing148 Questions
Exam 10: Statistical Inferences Based on Two Samples132 Questions
Exam 11: Experimental Design and Analysis of Variance115 Questions
Exam 12: Chi-Square Tests96 Questions
Exam 13: Simple Linear Regression Analysis148 Questions
Exam 14: Multiple Regression122 Questions
Exam 15: Model Building and Model Diagnostics102 Questions
Exam 16: Time Series Forecasting150 Questions
Exam 17: Process Improvement Using Control Charts122 Questions
Exam 18: Nonparametric Methods97 Questions
Exam 19: Decision Theory90 Questions
Select questions type
Consider the following partial computer output from a simple linear regression analysis. 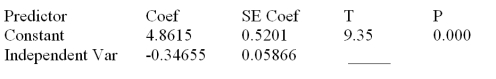 S = 0.4862 R-Sq = ______ Analysis of Variance
 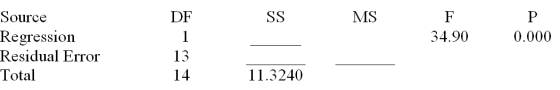 What is the predicted value of y when x = 9.00?
(Multiple Choice)
4.9/5  (32)
(32)
A local tire dealer wants to predict the number of tires sold each month.He believes that the number of tires sold is a linear function of the amount of money invested in advertising.He randomly selects 6 months of data consisting of tire sales (in thousands of tires)and advertising expenditures (in thousands of dollars).Based on the data set with 6 observations,the simple linear regression model yielded the following results.  = 24
= 24  = 124
= 124  = 42
= 42  = 338
= 338  = 196 Determine the value of the F statistic.
(Multiple Choice)
4.9/5 (32)
The strength of the relationship between two quantitative variables can be measured by:
(Multiple Choice)
4.8/5 (35)
When there is positive autocorrelation,over time,negative error terms are followed by positive error terms and positive error terms are followed by negative error terms.
(True/False)
4.8/5 (32)
For the same value X (independent variable),the confidence interval for the average value of Y (dependent variable)is __________________ the prediction interval for the individual value of Y.
(Multiple Choice)
4.8/5 (32)
A data set with 7 observations yielded the following.Use the simple linear regression model.  = 21.57
  = 68.31
  = 188.9
  = 5,140.23
  = 590.83 SSE = 1.06
Calculate the correlation coefficient.
= 590.83 SSE = 1.06
Calculate the correlation coefficient.
(Multiple Choice)
4.7/5 (41)
Consider the following partial computer output from a simple linear regression analysis. 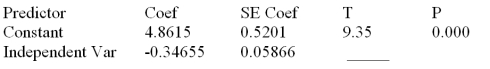 S = 0.4862 R-Sq = ______ Analysis of Variance
 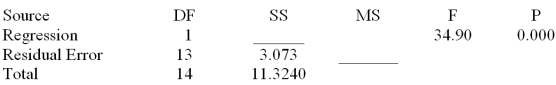 What is the coefficient of determination?
(Multiple Choice)
4.7/5 (35)
In simple linear regression analysis,we assume that the variance of the independent variable (X)is equal to the variance of the dependent variable (Y).
(True/False)
4.8/5 (41)
When the constant variance assumption holds,a plot of the residual versus x:
(Multiple Choice)
4.8/5 (43)
Consider the following partial computer output from a simple linear regression analysis. 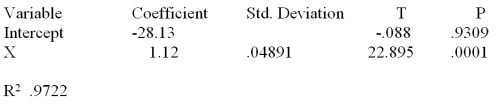 What is the estimated slope?
(Multiple Choice)
4.8/5 (37)
Consider the following partial computer output from a simple linear regression analysis.  S = 0.4862 R-Sq = ______ Analysis of Variance
 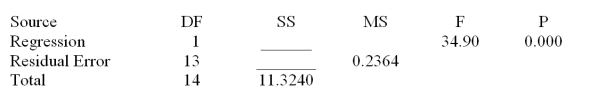 Calculate the SSE
(Multiple Choice)
4.8/5 (31)
An experiment was performed on a certain metal to determine if the strength is a function of heating time.The simple linear regression equation is  = 1 + 1X.The time is in minutes and the strength is measured in pounds per square inch. The 95% confidence interval for the slope is from .564 to 1.436.Can we reject 1 = 0?
(Multiple Choice)
4.8/5 (37)
Use the following results obtained from a simple linear regression analysis with 12 observations.  = 37.2895 - (1.2024)X r2 = .6744 sb = .2934
Test to determine if there is a significant negative relationship between the independent and dependent variable at = .05.Give the test statistic and the resulting conclusion.
= 37.2895 - (1.2024)X r2 = .6744 sb = .2934
Test to determine if there is a significant negative relationship between the independent and dependent variable at = .05.Give the test statistic and the resulting conclusion.
(Multiple Choice)
4.9/5 (35)
Consider the following partial computer output from a simple linear regression analysis. 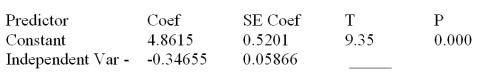 S = 0.4862 R-Sq = ______ Analysis of Variance
 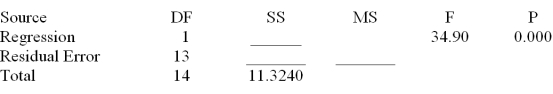 Test H0:
  1 = 0 versus Ha:
  1 0 by setting
  = .001.What do you conclude about the relationship between y and x?
(Multiple Choice)
4.7/5 (30)
Regression Analysis 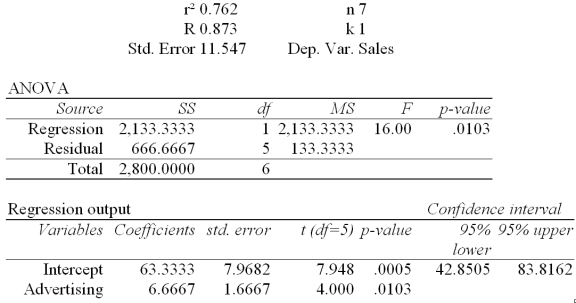 The local grocery store wants to predict the daily sales in dollars.The manager believes that the amount of newspaper advertising significantly affects the store sales.He randomly selects 7 days of data consisting of daily grocery store sales (in thousands of dollars)and advertising expenditures (in thousands of dollars).The Excel/Mega-Stat output given above summarizes the results of the regression model. What are the limits of the 95% confidence interval for the population slope?
(Multiple Choice)
4.8/5 (37)
The following results were obtained from a simple regression analysis:  = 37.2895 - (1.2024)X r2= .6744 sb = .2934
When X (independent variable)is equal to zero,the estimated value of Y (dependent variable)is equal to:
= 37.2895 - (1.2024)X r2= .6744 sb = .2934
When X (independent variable)is equal to zero,the estimated value of Y (dependent variable)is equal to:
(Multiple Choice)
4.7/5 (36)
An experiment was performed on a certain metal to determine if the strength is a function of heating time.Results based on 10 metal sheets are given below.Use the simple linear regression model.  = 30
= 30  = 104
= 104  = 40
= 40  = 178
= 178  = 134 Find the t statistic and test H0: B1 0 vs.Ha: B1 > 0 at = .05.
(Multiple Choice)
4.7/5 (36)
In simple regression analysis,if the correlation coefficient is a positive value,then
(Multiple Choice)
4.8/5 (32)
If r = -1,then we can conclude that there is a perfect relationship between X and Y.
(True/False)
4.7/5 (33)
A data set with 7 observations yielded the following.Use the simple linear regression model.  = 21.57
  = 68.31
  = 188.9
  = 5,140.23
  = 590.83 SSE = 1.06
Find the rejection point for the t statistic (
= 590.83 SSE = 1.06
Find the rejection point for the t statistic (  = .05).Test H0: 1 0 vs.Ha: 1 > 0.
(Multiple Choice)
4.7/5 (41)
Filters
- Essay(0)
- Multiple Choice(0)
- Short Answer(0)
- True False(0)
- Matching(0)