Exam 13: Simple Linear Regression Analysis
Exam 1: An Introduction to Business Statistics54 Questions
Exam 2: Descriptive Statistics: Tabular and Graphical Methods90 Questions
Exam 3: Descriptive Statistics: Numerical Methods149 Questions
Exam 4: Probability135 Questions
Exam 5: Discrete Random Variables128 Questions
Exam 6: Continuous Random Variables150 Questions
Exam 7: Sampling and Sampling Distributions116 Questions
Exam 8: Confidence Intervals144 Questions
Exam 9: Hypothesis Testing148 Questions
Exam 10: Statistical Inferences Based on Two Samples132 Questions
Exam 11: Experimental Design and Analysis of Variance115 Questions
Exam 12: Chi-Square Tests96 Questions
Exam 13: Simple Linear Regression Analysis148 Questions
Exam 14: Multiple Regression122 Questions
Exam 15: Model Building and Model Diagnostics102 Questions
Exam 16: Time Series Forecasting150 Questions
Exam 17: Process Improvement Using Control Charts122 Questions
Exam 18: Nonparametric Methods97 Questions
Exam 19: Decision Theory90 Questions
Select questions type
A data set with 7 observations yielded the following.Use the simple linear regression model.  = 21.57
  = 68.31
  = 188.9
  = 5,140.23
  = 590.83 SSE = 1.06
Find the estimated slope.
= 590.83 SSE = 1.06
Find the estimated slope.
(Multiple Choice)
4.9/5  (36)
(36)
A local tire dealer wants to predict the number of tires sold each month.He believes that the number of tires sold is a linear function of the amount of money invested in advertising.He randomly selects 6 months of data consisting of monthly tire sales (in thousands of tires)and monthly advertising expenditures (in thousands of dollars).Residuals are calculated for all of the randomly selected six months and ordered from smallest to largest. Determine the normal score for the smallest residual.
(Multiple Choice)
4.8/5 (33)
The correlation coefficient is the ratio of explained variation to total variation.
(True/False)
4.9/5 (27)
The slope of the simple linear regression equation represents the average change in the value of the dependent variable per unit change in the independent variable (X).
(True/False)
5.0/5 (40)
Which of the following is a violation of one of the major assumptions of the simple regression model?
(Multiple Choice)
5.0/5 (31)
If the points are tightly distributed around the regression line on a scatter diagram,then we can conclude that the changes in the value of the dependent variable _________ the independent variable (X).
(Multiple Choice)
4.9/5 (33)
A data set with 7 observations yielded the following.Use the simple linear regression model.  = 21.57
  = 68.31
  = 188.9
  = 5,140.23
  = 590.83 SSE = 1.06
Determine the 95% confidence interval for the average value of Y when x = 3.25.
= 590.83 SSE = 1.06
Determine the 95% confidence interval for the average value of Y when x = 3.25.
(Multiple Choice)
4.9/5 (40)
The following results were obtained from a simple regression analysis:  = 37.2895 - (1.2024)X r2= .6744 sb = .2934
For each unit change in X (independent variable),the estimated change in Y (dependent variable)is equal to:
= 37.2895 - (1.2024)X r2= .6744 sb = .2934
For each unit change in X (independent variable),the estimated change in Y (dependent variable)is equal to:
(Multiple Choice)
4.9/5 (35)
When using simple linear regression,we would like to use confidence intervals for the _____ and prediction intervals for the _____ at a given value of x.
(Multiple Choice)
4.9/5 (31)
An experiment was performed on a certain metal to determine if the strength is a function of heating time.Results based on 10 metal sheets are given below.Use the simple linear regression model.  = 30
= 30  = 104
= 104  = 40
= 40  = 178
= 178  = 134 Determine SSE,SS (Total)
(Multiple Choice)
4.8/5 (31)
In a simple regression analysis for a given data set,if the null hypothesis = 0 is rejected,then the null hypothesis = 0 is also rejected.This statement is ___________ true.
(Multiple Choice)
4.7/5 (39)
A local tire dealer wants to predict the number of tires sold each month.He believes that the number of tires sold is a linear function of the amount of money invested in advertising.He randomly selects 6 months of data consisting of tire sales (in thousands of tires)and advertising expenditures (in thousands of dollars).Based on the data set with 6 observations,the simple linear regression model yielded the following results.  = 24
= 24  = 124
= 124  = 42
= 42  = 338
= 338  = 196 Find the rejection point for the t statistic at = .05 and test H0: 1 = 0 vs.Ha: 1 0.
(Multiple Choice)
4.8/5 (40)
A local tire dealer wants to predict the number of tires sold each month.He believes that the number of tires sold is a linear function of the amount of money invested in advertising.He randomly selects 6 months of data consisting of tire sales (in thousands of tires)and advertising expenditures (in thousands of dollars).Based on the data set with 6 observations,the simple linear regression model yielded the following results.  = 24
= 24  = 124
= 124  = 42
= 42  = 338
= 338  = 196 Calculate the standard error.
(Multiple Choice)
4.7/5 (39)
Consider the following partial computer output from a simple linear regression analysis. 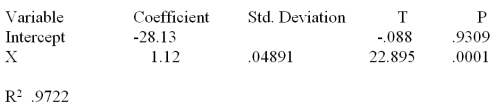 Calculate the correlation coefficient.
(Multiple Choice)
4.9/5 (36)
An experiment was performed on a certain metal to determine if the strength is a function of heating time.The simple linear regression equation is  = 1 + 1X.The time is in minutes and the strength is measured in pounds per square inch. Provide a managerial interpretation of the slope.
(Multiple Choice)
4.9/5 (37)
An experiment was performed on a certain metal to determine if the strength is a function of heating time.The sample size consists of ten metal sheets.Residuals are calculated for all ten metal sheets and ordered from smallest to largest. Determine the normal point for the second largest residual (ninth residual in the ordered array).
(Multiple Choice)
4.9/5 (36)
_____ is a statistical technique in which we use observed data to relate a dependent variable to one or more predictor (independent)variables.
(Multiple Choice)
4.8/5 (34)
Consider the following partial computer output from a simple linear regression analysis. 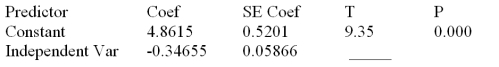 S = 0.4862 R-Sq = ______ Analysis of Variance
 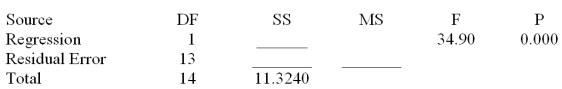 Calculate the MSE.
(Multiple Choice)
4.9/5 (38)
_____ distribution is used for testing the significance of the slope term.
(Multiple Choice)
4.8/5 (30)
_____ measures the strength of the linear relationship between the dependent and the independent variable.
(Multiple Choice)
4.8/5 (36)
Filters
- Essay(0)
- Multiple Choice(0)
- Short Answer(0)
- True False(0)
- Matching(0)