Exam 13: Simple Linear Regression Analysis
Exam 1: An Introduction to Business Statistics54 Questions
Exam 2: Descriptive Statistics: Tabular and Graphical Methods90 Questions
Exam 3: Descriptive Statistics: Numerical Methods149 Questions
Exam 4: Probability135 Questions
Exam 5: Discrete Random Variables128 Questions
Exam 6: Continuous Random Variables150 Questions
Exam 7: Sampling and Sampling Distributions116 Questions
Exam 8: Confidence Intervals144 Questions
Exam 9: Hypothesis Testing148 Questions
Exam 10: Statistical Inferences Based on Two Samples132 Questions
Exam 11: Experimental Design and Analysis of Variance115 Questions
Exam 12: Chi-Square Tests96 Questions
Exam 13: Simple Linear Regression Analysis148 Questions
Exam 14: Multiple Regression122 Questions
Exam 15: Model Building and Model Diagnostics102 Questions
Exam 16: Time Series Forecasting150 Questions
Exam 17: Process Improvement Using Control Charts122 Questions
Exam 18: Nonparametric Methods97 Questions
Exam 19: Decision Theory90 Questions
Select questions type
Consider the following partial computer output from a simple linear regression analysis. 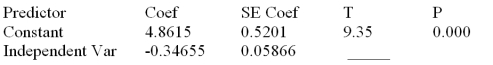 S = 0.4862 R-Sq = ______ Analysis of Variance
 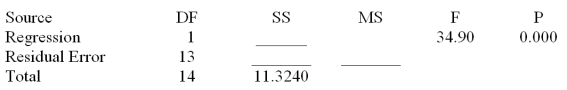 Determine the 95% confidence interval for the mean value of y when x = 9.00.Givens: x = 129.03 and x2 = 1178.547
(Multiple Choice)
4.8/5  (32)
(32)
An experiment was performed on a certain metal to determine if the strength is a function of heating time.The simple linear regression equation is  = 1 + 1X.The time is in minutes and the strength is measured in pounds per square inch. Determine the predicted value of y when x = 4.
(Multiple Choice)
4.8/5 (29)
Regression Analysis 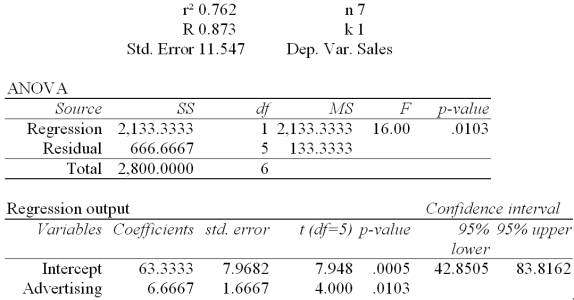 The local grocery store wants to predict the daily sales in dollars.The manager believes that the amount of newspaper advertising significantly affects the store sales.He randomly selects 7 days of data consisting of daily grocery store sales (in thousands of dollars)and advertising expenditures (in thousands of dollars).The Excel/Mega-Stat output given above summarizes the results of the regression model. In testing the population for significance at a significance level of .05,what is the rejection point condition for the two-sided test?
(Multiple Choice)
4.8/5 (37)
A simple regression analysis with 20 observations would yield ________ degrees of freedom error and _________ degrees of freedom total.
(Multiple Choice)
4.9/5 (28)
Regression Analysis 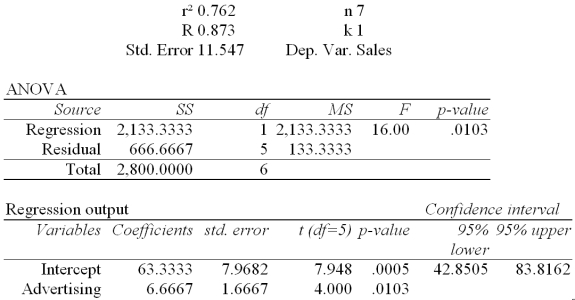 The local grocery store wants to predict the daily sales in dollars.The manager believes that the amount of newspaper advertising significantly affects the store sales.He randomly selects 7 days of data consisting of daily grocery store sales (in thousands of dollars)and advertising expenditures (in thousands of dollars).The Excel/Mega-Stat output given above summarizes the results of the regression model. In testing the simple linear regression equation for significance at a significance level of .05,what is the rejection point condition?
(Multiple Choice)
4.7/5 (38)
A local tire dealer wants to predict the number of tires sold each month.He believes that the number of tires sold is a linear function of the amount of money invested in advertising.He randomly selects 6 months of data consisting of tire sales (in thousands of tires)and advertising expenditures (in thousands of dollars).Based on the data set with 6 observations,the simple linear regression equation of the least squares line is  = 3 + 1x.
  = 24
= 24  = 124
= 124  = 42
= 42  = 338
= 338  = 196 MSE = 4
Use the least squares regression equation and estimate the monthly tire sales when advertising expenditures is $4000.
= 196 MSE = 4
Use the least squares regression equation and estimate the monthly tire sales when advertising expenditures is $4000.
(Multiple Choice)
4.9/5 (26)
The coefficient of determination measures the ________ explained by the simple linear regression model.
(Multiple Choice)
4.9/5 (30)
Regression Analysis 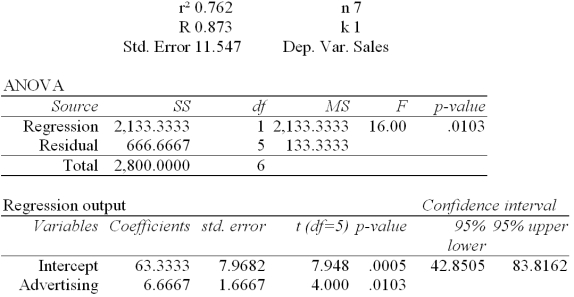 The local grocery store wants to predict the daily sales in dollars.The manager believes that the amount of newspaper advertising significantly affects the store sales.He randomly selects 7 days of data consisting of daily grocery store sales (in thousands of dollars)and advertising expenditures (in thousands of dollars).The Excel/Mega-Stat output given above summarizes the results of the regression model. What is the value of the simple coefficient of determination?
(Multiple Choice)
4.8/5 (37)
The following results were obtained from a simple regression analysis:  = 37.2895 - (1.2024)X r2= .6744 sb = .2934
____________ is the proportion of the variation explained by the simple linear regression model.
= 37.2895 - (1.2024)X r2= .6744 sb = .2934
____________ is the proportion of the variation explained by the simple linear regression model.
(Multiple Choice)
4.9/5 (37)
Complete the following partial ANOVA table from a simple linear regression analysis with a sample size of 16 observations.Find the F test to test the significance of the model. 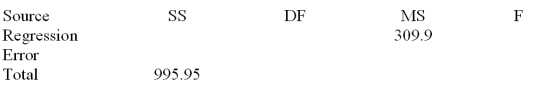
(Multiple Choice)
5.0/5 (40)
An experiment was performed on a certain metal to determine if the strength is a function of heating time.Partial results based on a sample of 10 metal sheets are given below.The simple linear regression equation is  = 1 + 1X .The time is in minutes and the strength is measured in pounds per square inch,MSE = 0.5,
  = 30,
= 30,  = 104. Determine the 95% prediction interval for the strength of a metal sheet when the average heating time is 2.5 minutes.
(Multiple Choice)
4.9/5 (32)
A local tire dealer wants to predict the number of tires sold each month.He believes that the number of tires sold is a linear function of the amount of money invested in advertising.He randomly selects 6 months of data consisting of tire sales (in thousands of tires)and advertising expenditures (in thousands of dollars).The equation of the least squares line is,  = 3 + 1x. Provide a managerial interpretation of the estimated slope.
(Multiple Choice)
5.0/5 (44)
A local tire dealer wants to predict the number of tires sold each month.He believes that the number of tires sold is a linear function of the amount of money invested in advertising.He randomly selects 6 months of data consisting of monthly tire sales (in thousands of tires)and monthly advertising expenditures (in thousands of dollars).The simple linear regression equation is  = 3 + 1X and sample correlation coefficient (r2)= .6364.Test to determine if there is a significant correlation between the monthly tire sales and monthly advertising expenditures.Use H0: = 0 vs.HA: 0 at = .05.
(Multiple Choice)
4.9/5 (33)
Use the least squares regression equation,  = 12.36 + 4.745(X),and determine the predicted value of Y when X = 3.25?
(Multiple Choice)
4.8/5 (29)
The experimental region is the range of the previously observed values of the dependent variable.
(True/False)
4.9/5 (29)
Any value of the error term in a regression model is _____ any other value of the error term.
(Multiple Choice)
4.8/5 (30)
An experiment was performed on a certain metal to determine if the strength is a function of heating time.Partial results based on a sample of 10 metal sheets are given below.The simple linear regression equation is  = 1 + 1X .The time is in minutes and the strength is measured in pounds per square inch,MSE = 0.5,
  = 30,
= 30,  = 104. Determine the 95% confidence interval for the mean value of metal strength when the average heating time is 4 minutes.
(Multiple Choice)
4.8/5 (36)
If one of the assumptions of the regression model is violated,performing data transformations on the ____________ can remedy the situation.
(Multiple Choice)
4.7/5 (36)
A ______________________ measures the strength of the relationship between a dependent variable (Y)and an independent variable (X).
(Multiple Choice)
4.9/5 (46)
A data set with 7 observations yielded the following.Use the simple linear regression model.  = 21.57
  = 68.31
  = 188.9
  = 5,140.23
  = 590.83 SSE = 1.06
Calculate the coefficient of determination.
= 590.83 SSE = 1.06
Calculate the coefficient of determination.
(Multiple Choice)
4.9/5 (42)
Filters
- Essay(0)
- Multiple Choice(0)
- Short Answer(0)
- True False(0)
- Matching(0)