Exam 1: Functions and Limits
Exam 1: Functions and Limits95 Questions
Exam 2: Derivatives84 Questions
Exam 3: Applications of Differentiation155 Questions
Exam 4: Integrals169 Questions
Exam 5: Applications of Integration70 Questions
Exam 6: Inverse Functions95 Questions
Exam 7: Techniques of Integration124 Questions
Exam 8: Further Applications of Integration87 Questions
Exam 9: Differential Equations67 Questions
Exam 10: Parametric Equations and Polar Coordinates73 Questions
Exam 11: Infinite Sequences and Series158 Questions
Exam 12: Vectors and the Geometry of Space60 Questions
Exam 13: Vector Functions93 Questions
Exam 14: Partial Derivatives132 Questions
Exam 15: Multiple Integrals124 Questions
Exam 16: Vector Calculus137 Questions
Exam 17: Second-Order Differential Equations63 Questions
Exam 18: Final Exam44 Questions
Select questions type
A box with an open top is to be constructed from a rectangular piece of card board with dimensions in. by in. by cutting out equal squares of side at each corner and then folding up the sides as in the figure. Express the volume of the box as a function of . 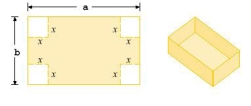
(Multiple Choice)
4.8/5  (36)
(36)
Find the domain and sketch the graph of the function. What is its range? f (x) =
(Multiple Choice)
4.8/5 (32)
It makes sense that the larger the area of a region, the larger the number of species that inhabit the region. Many ecologists have modeled the species-area relation with a power function and, in particular, the number of species S of bats living in caves in central Mexico has been related to the surface area A measured in of the caves by the equation (a) The cave called mission impossible near puebla, mexico, has suface area of .
How many species of bats would expect to find in that cave?
(b) If you discover that 5 species of bats live in cave estimate the area of the cave.
(Short Answer)
4.9/5 (26)
Use the laws of logarithms to write the expression as the logarithm of a single quantity. 4 ln 5 - ln (x + 6)
(Multiple Choice)
4.8/5 (29)
Find all solutions of the equation correct to two decimal places.
(Short Answer)
4.9/5 (41)
Use the table to evaluate the expression .
1 2 3 4 5 6 x 3 2 1 0 1 2 f(x) 6 5 2 3 4 6 g(x)
(Multiple Choice)
4.9/5 (41)
Find the inverse of
f. Then use a graphing utility to plot the graphs of f and on the same set of axes.
(Short Answer)
5.0/5 (34)
Starting with the graph of , find the equation of the graph that results from reflecting about the line .
(Multiple Choice)
4.9/5 (41)
The following figure shows a portion of the graph of a function f defined on the interval . Sketch the complete graph of f if it is known f is odd.
![The following figure shows a portion of the graph of a function f defined on the interval [-1,1] . Sketch the complete graph of f if it is known f is odd. <sub> </sub> <sub> </sub>](https://storage.examlex.com/TB5972/11eaa3fc_c151_c8d0_b1e4_d9bebd9bd1fa_TB5972_00.jpg)
(Short Answer)
4.9/5 (39)
Refer to the graph of the function f in the following figure. 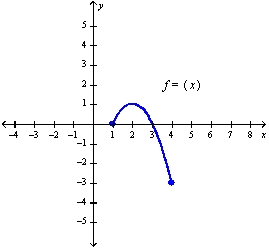 a. Find f (1).
b. Find the value of x for which (i) and (ii) .
c. Find the domain and range of
f.
a. Find f (1).
b. Find the value of x for which (i) and (ii) .
c. Find the domain and range of
f.
(Short Answer)
4.7/5 (33)
The table gives the population of the United States, in millions, for the years 1900 - 2000. Use a graphing calculator with exponential regression capability to model the U.S. population since 1900. Use the model to estimate the population in 1965 and to predict the population in the year 2025.
Year 1900 1910 1920 1930 1940 1950 1960 1970 1980 1990 2000 Population (millions) 76 92 106 123 131 150 179 203 227 250 281
(Multiple Choice)
4.8/5 (29)
Filters
- Essay(0)
- Multiple Choice(0)
- Short Answer(0)
- True False(0)
- Matching(0)