Exam 2: Tabular and Graphical Methods
Exam 1: Statistics and Data100 Questions
Exam 2: Tabular and Graphical Methods123 Questions
Exam 3: Numerical Descriptive Measures151 Questions
Exam 4: Basic Probability Concepts116 Questions
Exam 5: Discrete Probability Distributions139 Questions
Exam 6: Continuous Probability Distributions128 Questions
Exam 7: Sampling and Sampling Distributions124 Questions
Exam 8: Interval Estimation123 Questions
Exam 9: Hypothesis Testing135 Questions
Exam 10: Statistical Inference Concerning Two Populations124 Questions
Exam 11: Statistical Inference Concerning Variance111 Questions
Exam 12: Chi-Square Tests120 Questions
Exam 13: Analysis of Variance58 Questions
Exam 14: Regression Analysis140 Questions
Exam 15: Inference With Regression Models124 Questions
Exam 16: Regression Models for Nonlinear Relationships115 Questions
Exam 17: Regression Models With Dummy Variables114 Questions
Exam 18: Time Series and Forecasting124 Questions
Exam 19: Returns, Index Numbers and Inflation120 Questions
Exam 20: Nonparametric Tests108 Questions
Select questions type
An analyst constructed the following frequency distribution on the monthly returns for 50 selected stocks: An analyst constructed the following frequency distribution on the monthly returns for 50 selected stocks. 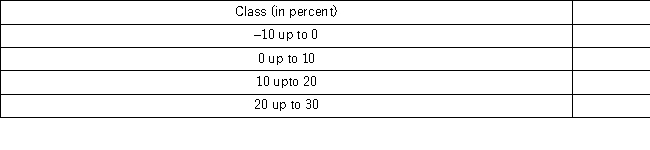 The proportion of stocks with returns of 0% up to 10% is ______.
(Multiple Choice)
4.8/5  (37)
(37)
An analyst constructed the following frequency distribution on the monthly returns for 50 selected stocks.  The number of stocks with returns of 0% up to 10% is ______.
(Multiple Choice)
4.7/5 (30)
When constructing a scatterplot for two quantitative variables,we usually refer to one variable as x and another one as y.Typically,we graph x on the vertical axis and y on the horizontal axis.
(True/False)
4.9/5 (29)
The following data represent the recent sales price (in $1,000s)of 24 homes in a midwestern city. 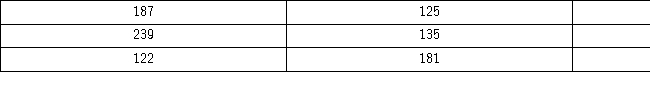 Suppose the data are grouped into five classes,and one of them will be "115 up to 140." -that is,{x;115 ≤ x < 140}.The relative frequency of this class is ______.
(Multiple Choice)
4.8/5 (40)
The organization of the Girl Sprouts has completed its annual cookie drive.The sales are reported in the accompanying ogive. 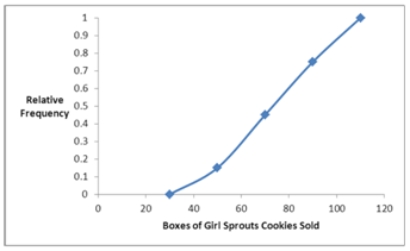 Approximate the percentage of girls who sold more than 70 boxes of cookies.
(Multiple Choice)
4.8/5 (30)
The following data represent the recent sales price (in $1,000s)of 24 homes in a Midwestern city.  Suppose the data are grouped into five classes,and one of them will be "165 up to 190." -that is,{x;165 ≤ x < 190}.The frequency of this class is _____.
(Multiple Choice)
4.8/5 (43)
A frequency distribution for qualitative data groups these data into classes called intervals and records the total number of observations in each class.
(True/False)
4.8/5 (42)
Which of the following best describes a frequency distribution for qualitative data?
(Multiple Choice)
4.9/5 (35)
A statistics instructor computes the grade and percentage of classes that each of his students attends.Construct a scatterplot from the data displayed next.Does a relationship exist between attendance and grade? 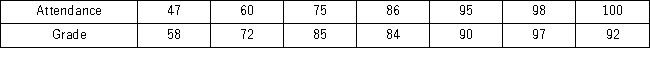
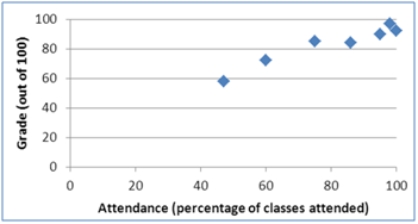
(Essay)
4.9/5 (33)
Students in Professor Smith's business statistics course have evaluated the overall effectiveness of the professor's instruction on a five-point scale,where a score of 1 indicates very poor performance and a score of 5 indicates outstanding performance.The raw scores are displayed in the accompanying table: 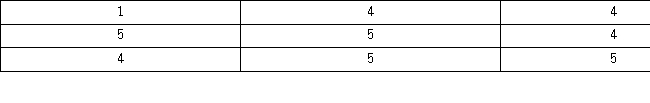 What is the most common score given in the evaluations?
(Multiple Choice)
4.9/5 (41)
The following table shows average wind speeds (in miles per hour)during 15 major fires in California.  Construct a stem-and-leaf diagram.Were most of these storms fueled by 45+ mile-per-hour winds? Explain.
(Essay)
4.7/5 (34)
Consider the following stem-and-leaf diagram. 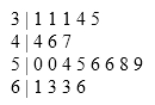 Which of the following statements is correct?
(Multiple Choice)
4.8/5 (27)
Consider the following frequency distribution.  How many observations are less than 21?
(Multiple Choice)
4.9/5 (43)
For quantitative data,a cumulative relative frequency distribution records the proportion (fraction)of values that fall below the upper limit of each class.
(True/False)
4.7/5 (37)
The following data represent scores on a pop quiz in a statistics section. 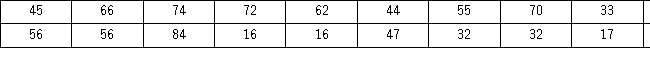 Suppose the data on quiz scores will be grouped into five classes.The width of the classes for a frequency distribution or histogram is the closestto ______.
(Multiple Choice)
4.9/5 (41)
In the accompanying stem-and-leaf diagram,the values in the stem-and-leaf portions represent 10s and 1s digits,respectively. 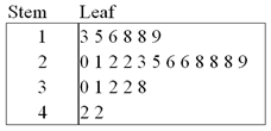 The stem-and-leaf diagram shows that the distribution is ___________.
(Multiple Choice)
4.9/5 (37)
The accompanying relative frequency distribution represents the last year car sales for the sales force at Kelly's Mega Used Car Center. 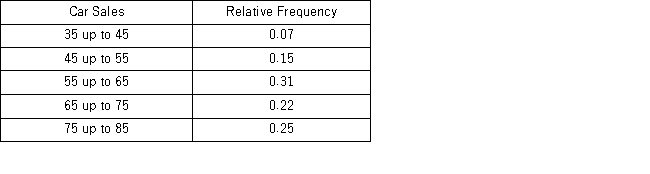 If Kelly's employs 100 salespeople,how many of these salespeople have sold at least 65 cars in the last year?
(Multiple Choice)
4.9/5 (38)
In the accompanying stem-and-leaf diagram,the values in the stem and leaf portions represent 10s and 1s digits,respectively.  Which of the following numbers appears in the stem-and-leaf diagram?
(Multiple Choice)
4.7/5 (43)
To approximate the width of a class in the creation of a bar chart,we may use this formula: 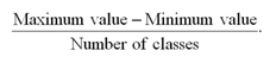
(True/False)
4.7/5 (29)
Consider the following frequency distribution. 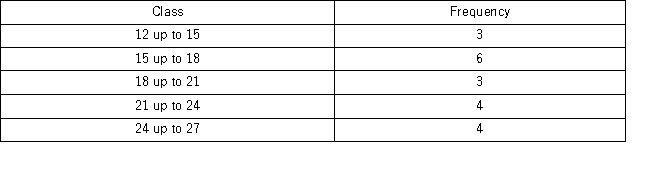 How many observations are at least 15 but less than 18?
(Multiple Choice)
4.9/5 (38)
Filters
- Essay(0)
- Multiple Choice(0)
- Short Answer(0)
- True False(0)
- Matching(0)