Exam 2: Tabular and Graphical Methods
Exam 1: Statistics and Data100 Questions
Exam 2: Tabular and Graphical Methods123 Questions
Exam 3: Numerical Descriptive Measures151 Questions
Exam 4: Basic Probability Concepts116 Questions
Exam 5: Discrete Probability Distributions139 Questions
Exam 6: Continuous Probability Distributions128 Questions
Exam 7: Sampling and Sampling Distributions124 Questions
Exam 8: Interval Estimation123 Questions
Exam 9: Hypothesis Testing135 Questions
Exam 10: Statistical Inference Concerning Two Populations124 Questions
Exam 11: Statistical Inference Concerning Variance111 Questions
Exam 12: Chi-Square Tests120 Questions
Exam 13: Analysis of Variance58 Questions
Exam 14: Regression Analysis140 Questions
Exam 15: Inference With Regression Models124 Questions
Exam 16: Regression Models for Nonlinear Relationships115 Questions
Exam 17: Regression Models With Dummy Variables114 Questions
Exam 18: Time Series and Forecasting124 Questions
Exam 19: Returns, Index Numbers and Inflation120 Questions
Exam 20: Nonparametric Tests108 Questions
Select questions type
An auto parts chain asked customers to complete a survey rating the chain's customer service as average,above average,or below average.The following shows the results from the survey: 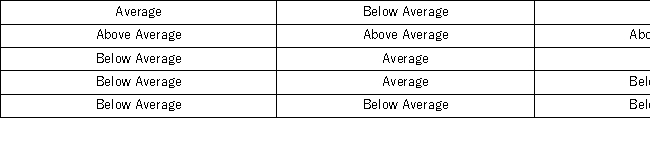 The proportion of customers who felt the customer service was Average is the closest to _______.
(Multiple Choice)
4.8/5  (30)
(30)
The dividend yields of the stocks in an investor's portfolio are shown in the following cumulative relative frequency distribution. 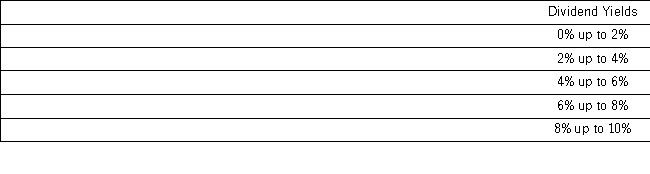 a.Construct an ogive.
b.Approximately what percent of the stocks had a dividend yield of 3% or larger?
a.Construct an ogive.
b.Approximately what percent of the stocks had a dividend yield of 3% or larger?
(Essay)
4.9/5 (30)
Students in Professor Smith's business statistics course have evaluated the overall effectiveness of the professor's instruction on a five-point scale,where a score of 1 indicates very poor performance and a score of 5 indicates outstanding performance.The raw scores are displayed in the accompanying table.  What percentage of students gave professor Smith an evaluation higher than 3?
(Multiple Choice)
4.8/5 (35)
A survey of 400 unemployed people was completed at a job fair.Each person was asked to categorize his or her job interests.The accompanying relative frequency distribution was constructed. 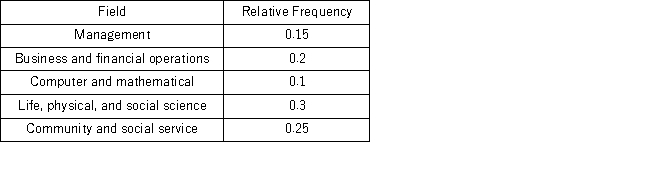 a.Construct the corresponding frequency distribution.How many of these people designated that the computer and mathematical industry was their job interest?
b.Construct a pie chart.
a.Construct the corresponding frequency distribution.How many of these people designated that the computer and mathematical industry was their job interest?
b.Construct a pie chart.
(Essay)
4.8/5 (31)
Thirty students at Eastside High School took the SAT on the same Saturday.Their raw scores are given next. 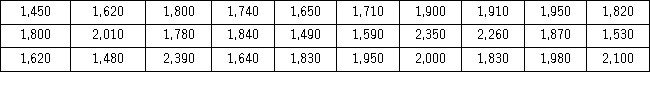 Consider a frequency distribution of the data that groups the data in classes of 1400 up to 1600,1600 up to 1800,1800 up to 2000,and so on.What graphical tool would you use to display the cumulative relative frequency of the grouped data?
(Multiple Choice)
4.8/5 (38)
The accompanying relative frequency distribution represents the last year car sales for the sales force at Kelly's Mega Used Car Center. 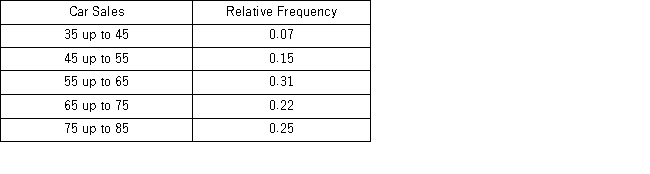 If Kelly's employs 100 salespeople,how many of these salespeople have sold at least 35 but fewer than 45 cars in the last year?
(Multiple Choice)
4.9/5 (41)
In the accompanying stem-and-leaf diagram,the values in the stem-and-leaf portions represent 10s and 1s digits,respectively.  Find the frequency associated with data values that are more than 28.
(Multiple Choice)
4.8/5 (37)
The following table shows analyst sentiment ratings for the 30 stocks listed in the Dow Jones Industrial Average.  a.Construct a frequency distribution,relative frequency distribution,cumulative frequency distribution and relative cumulative frequency distribution using classes of 2 up to 4,4 up to 6,6 up to 8,and 8 up to 10.
b.Construct a histogram that summarizes the data.
c.What percentage of the stocks in the Dow Jones Industrial Average received a sentiment rating less than 8?
d.What percentage of the stocks in the Dow Jones Industrial Average received a sentiment rating of 6 or more?
a.Construct a frequency distribution,relative frequency distribution,cumulative frequency distribution and relative cumulative frequency distribution using classes of 2 up to 4,4 up to 6,6 up to 8,and 8 up to 10.
b.Construct a histogram that summarizes the data.
c.What percentage of the stocks in the Dow Jones Industrial Average received a sentiment rating less than 8?
d.What percentage of the stocks in the Dow Jones Industrial Average received a sentiment rating of 6 or more?
(Essay)
4.9/5 (37)
Consider the following frequency distribution. 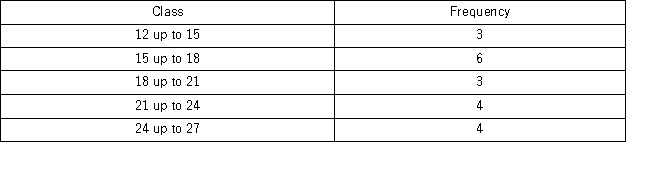 What proportion of the observations are less than 21?
(Multiple Choice)
4.8/5 (37)
Students in Professor Smith's business statistics course have evaluated the overall effectiveness of the professor's instruction on a five-point scale,where a score of 1 indicates very poor performance and a score of 5 indicates outstanding performance.The raw scores are displayed in the accompanying table.  What percentage of students gave Professor Smith an evaluation of 2 or less?
(Multiple Choice)
4.8/5 (25)
For quantitative data,a relative frequency distribution identifies the proportion of observations that fall into each class.
(True/False)
4.8/5 (21)
In the following pie chart representing a collection of cookbooks,which author has more titles? 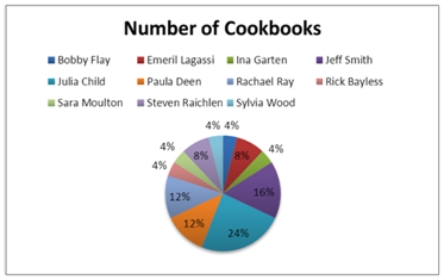
(Multiple Choice)
4.8/5 (33)
When constructing a frequency distribution for quantitative data classes are mutually _________ and ___________.
(Essay)
4.8/5 (39)
A city in California spent $6 million repairing damage to its public buildings in 2010.The following table shows the categories where the money was directed. 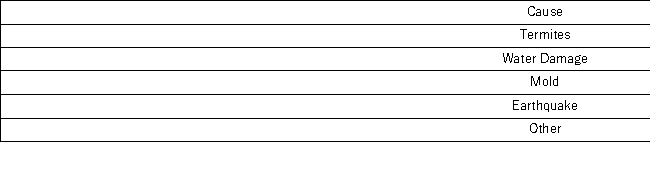 How much did the city spend to fix damage caused by mold?
(Multiple Choice)
4.9/5 (33)
A high school football league recorded the average points scored per game,as well as the winning percentage,for the 10 teams in the league. 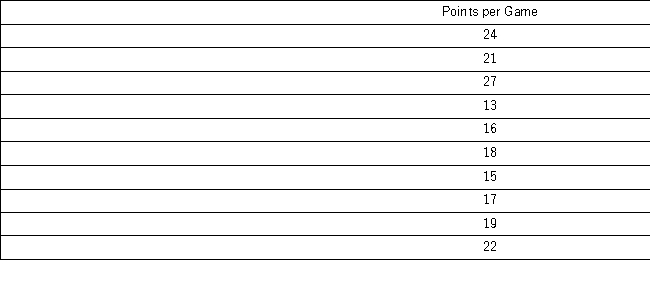 Construct a scatterplot.Does scoring more points appear to be associated with a higher winning percentage?
(Essay)
4.7/5 (29)
Graphically,we can show a(n)___________ ____________ for qualitative data by constructing a pie chart or a bar chart.
(Essay)
4.9/5 (34)
In the accompanying stem-and-leaf diagram,the values in the stem-and-leaf portions represent 10s and 1s digits,respectively. 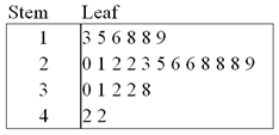 What would be the frequency of the class 35 up to 45,that is {x;35 ≤ x< 45}?
(Multiple Choice)
4.8/5 (40)
Construct a stem-and-leaf diagram with the following data set. 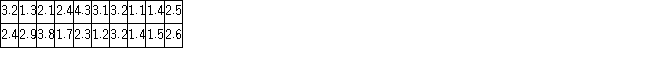 Is the distribution symmetric?
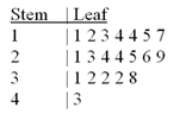
(Essay)
4.9/5 (38)
Filters
- Essay(0)
- Multiple Choice(0)
- Short Answer(0)
- True False(0)
- Matching(0)