Exam 2: Tabular and Graphical Methods
Exam 1: Statistics and Data100 Questions
Exam 2: Tabular and Graphical Methods123 Questions
Exam 3: Numerical Descriptive Measures151 Questions
Exam 4: Basic Probability Concepts116 Questions
Exam 5: Discrete Probability Distributions139 Questions
Exam 6: Continuous Probability Distributions128 Questions
Exam 7: Sampling and Sampling Distributions124 Questions
Exam 8: Interval Estimation123 Questions
Exam 9: Hypothesis Testing135 Questions
Exam 10: Statistical Inference Concerning Two Populations124 Questions
Exam 11: Statistical Inference Concerning Variance111 Questions
Exam 12: Chi-Square Tests120 Questions
Exam 13: Analysis of Variance58 Questions
Exam 14: Regression Analysis140 Questions
Exam 15: Inference With Regression Models124 Questions
Exam 16: Regression Models for Nonlinear Relationships115 Questions
Exam 17: Regression Models With Dummy Variables114 Questions
Exam 18: Time Series and Forecasting124 Questions
Exam 19: Returns, Index Numbers and Inflation120 Questions
Exam 20: Nonparametric Tests108 Questions
Select questions type
The organization of the Girl Sprouts has completed its annual cookie drive.The sales are reported in the accompanying ogive. 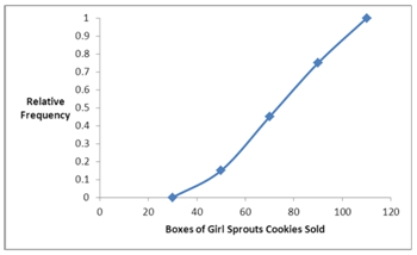 Approximate the percentage of girls who sold less than 90 boxes of cookies.
(Multiple Choice)
4.8/5  (39)
(39)
Use the following data to construct a scatterplot.What type of relationship is implied? 
(Multiple Choice)
4.8/5 (44)
Automobiles traveling on a road with a posted speed limit of 65 miles per hour are checked for speed by a state police radar system.The following table is a frequency distribution of speeds. 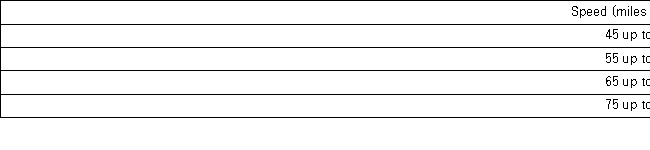 What proportion of the cars traveled at least 55 but less than 65 miles per hour?
(Multiple Choice)
5.0/5 (42)
When constructing a frequency distribution for quantitative data,it is important to remember that _____________.
(Multiple Choice)
4.8/5 (35)
What graphical tool is best used to display the relative frequency of grouped quantitative data?
(Multiple Choice)
4.9/5 (40)
The statistics professor has kept attendance records and recorded the number of absent students per class.The recorded data is displayed in the following histogram with the frequency of each number of absent students shown above the bars. 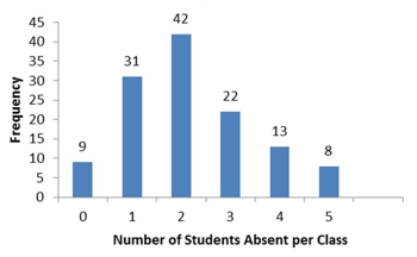 How many statistics classes had three or more students absent?
(Multiple Choice)
4.7/5 (31)
The following frequency distribution shows the frequency of the asking price,in thousands of dollars,for current homes on the market in a particular city. 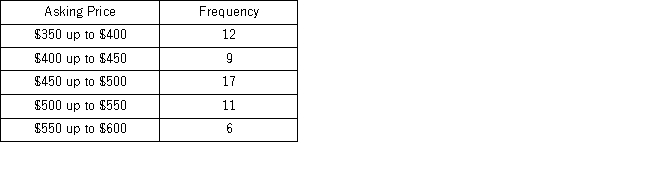 What percentage of houses has an asking price between $350,000 and under $400,000?
(Multiple Choice)
4.9/5 (26)
Thirty students at Eastside High School took the SAT on the same Saturday.Their raw scores are given next. 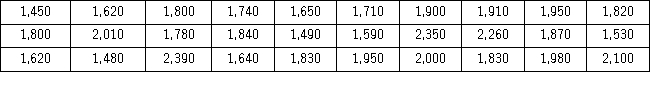 Consider a frequency distribution of the data that groups the data in classes of 1400 up to 1600,1600 up to 1800,1800 up to 2000,and so on.How many students scored at least 1800 but less than 2000?
(Multiple Choice)
4.9/5 (30)
T 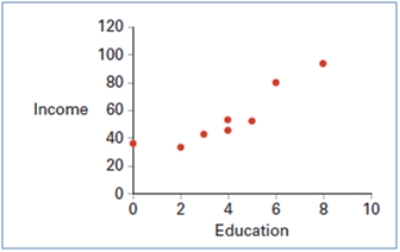 Using a scatterplot above we observe a _________ linear relationship between two variables: Education and Income.
(Essay)
4.9/5 (36)
Consider the following stem-and-leaf diagram. 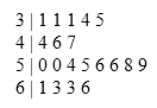 Which data value occurs most often?
(Multiple Choice)
4.8/5 (36)
When constructing a pie chart,only a few,the most frequent,categories must be included in the pie.
(True/False)
4.8/5 (37)
In the accompanying stem-and-leaf diagram,the values in the stem-and-leaf portions represent 10s and 1s digits,respectively. 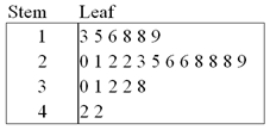 How many values are at least 25 but less than 35?
(Multiple Choice)
4.9/5 (33)
A city in California spent $6 million repairing damage to its public buildings in 2010.The following table shows the categories where the money was directed. 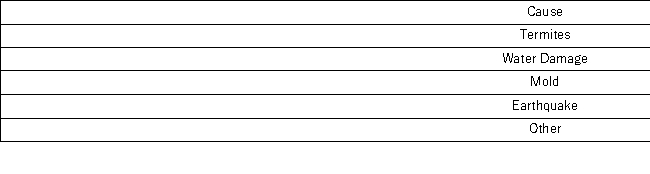 How much more did the city spend to fix damage caused by termites compared to the damage caused by water?
(Multiple Choice)
4.8/5 (31)
Frequency distributions may be used to describe which of the following types of data?
(Multiple Choice)
4.8/5 (32)
The following data represent scores on a pop quiz in a statistics section. 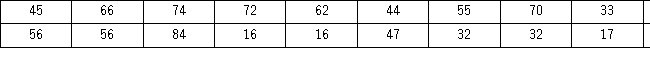 Suppose the data are grouped into five classes,and one of them will be "30 up to 44" -that is,{x;30 ≤ x < 44}.The relative frequency of this class is _____.
(Multiple Choice)
4.9/5 (36)
The accompanying relative frequency distribution represents the last year car sales for the sales force at Kelly's Mega Used Car Center. 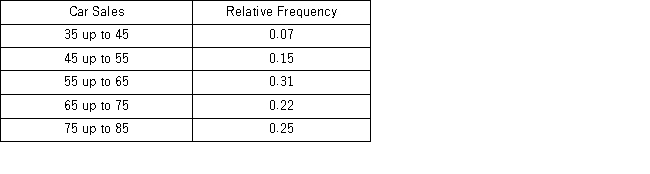 If Kelly's employs 100 salespeople,how many of these salespeople have sold at least 45 but fewer than 65 cars in the last year?
(Multiple Choice)
4.8/5 (31)
The following data represent scores on a pop quiz in a statistics section:  Suppose the data are grouped into five classes,and one of them will be "30 up to 44." that is,{x;30 ≤ x < 44}.The frequency of this class is _____.
(Multiple Choice)
4.8/5 (31)
An analyst constructed the following frequency distribution on the monthly returns for 50 selected stocks. 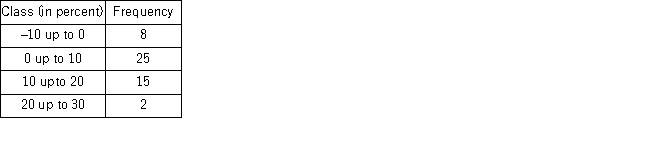 The proportion of stocks with returns of less than 10% is _____.
(Multiple Choice)
4.8/5 (34)
The following data represent the recent sales price (in $1,000s)of 24 homes in a Midwestern city. 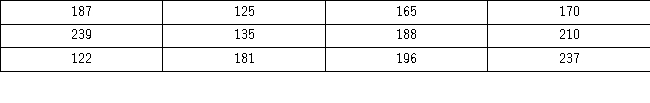 Suppose the data on house prices will be grouped into five classes.The width of the classes for a frequency distribution or histogram is the closest to _______.
(Multiple Choice)
4.8/5 (38)
Filters
- Essay(0)
- Multiple Choice(0)
- Short Answer(0)
- True False(0)
- Matching(0)