Exam 17: Statistics for Quality: Control and Capability
Exam 1: Looking at Datadistributions127 Questions
Exam 2: Looking at Datarelationships48 Questions
Exam 3: Producing Data70 Questions
Exam 4: Probability: the Study of Randomness93 Questions
Exam 5: Sampling Distributions77 Questions
Exam 6: Introduction to Inference89 Questions
Exam 7: Inference for Means103 Questions
Exam 8: Inference for Proportions101 Questions
Exam 9: Inference for Categorical Data122 Questions
Exam 10: Inference for Regression91 Questions
Exam 11: Multiple Regression95 Questions
Exam 12: One-Way Analysis of Variance74 Questions
Exam 13: Two-Way Analysis of Variance53 Questions
Exam 14: Logistic Regression53 Questions
Exam 15: Nonparametric Tests57 Questions
Exam 16: Bootstrap Methods and Permutation Tests42 Questions
Exam 17: Statistics for Quality: Control and Capability86 Questions
Select questions type
The 68-95-99.7 rule tells us that if a process with mean and standard deviation varies according to a Normal distribution,then almost all measurements on individual products will lie in the range ± 3.What do we call the values - 3 and + 3?
(Multiple Choice)
4.8/5  (37)
(37)
An important characteristic in the proper operation of ignition keys for automobiles is the groove width of the key.In a large manufacturing plant that produces thousands of keys,control charts have been established to monitor the process of cutting the groove.It is believed that the measurement (in inches)of the groove width is Normally distributed.Over a period of time,20 samples,each of size n = 5,were selected in order to establish 3-sigma  and s charts.From these samples the following were determined:
  = 0.15932 and
  = 0.0193438.For the
  chart that is being set up,what are the appropriate 3-sigma lower and upper control limits, (LCL,UCL)?
(Multiple Choice)
4.7/5 (34)
What do we call the ability of a process to meet or exceed the requirements placed on it?
(Multiple Choice)
4.8/5 (45)
Piston rings for an automotive engine are produced by a forging process.We monitor the inside diameter of the rings manufactured by this process using an  and an s control chart.Samples of size 4 are taken at regular intervals,and the sample means and standard deviations are computed and plotted on the charts in time order.The overall mean of the sample means is 73.812 millimeters,and the mean of the sample standard deviations is 0.022 millimeters.The control chart constants are (partially)reproduced below.
 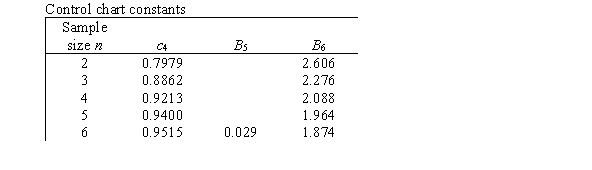 What is the value of the upper control limit for the
  chart?
(Multiple Choice)
4.8/5 (35)
A p chart is a control chart based on plotting ____________.
(Multiple Choice)
4.7/5 (44)
When we examine  and s charts,what is the best strategy to use?
(Multiple Choice)
4.7/5 (32)
Filters
- Essay(0)
- Multiple Choice(0)
- Short Answer(0)
- True False(0)
- Matching(0)