Exam 17: Statistics for Quality: Control and Capability
Exam 1: Looking at Datadistributions127 Questions
Exam 2: Looking at Datarelationships48 Questions
Exam 3: Producing Data70 Questions
Exam 4: Probability: the Study of Randomness93 Questions
Exam 5: Sampling Distributions77 Questions
Exam 6: Introduction to Inference89 Questions
Exam 7: Inference for Means103 Questions
Exam 8: Inference for Proportions101 Questions
Exam 9: Inference for Categorical Data122 Questions
Exam 10: Inference for Regression91 Questions
Exam 11: Multiple Regression95 Questions
Exam 12: One-Way Analysis of Variance74 Questions
Exam 13: Two-Way Analysis of Variance53 Questions
Exam 14: Logistic Regression53 Questions
Exam 15: Nonparametric Tests57 Questions
Exam 16: Bootstrap Methods and Permutation Tests42 Questions
Exam 17: Statistics for Quality: Control and Capability86 Questions
Select questions type
An important characteristic in the proper operation of ignition keys for automobiles is the groove width of the key.In a large manufacturing plant that produces thousands of keys,control charts have been established to monitor the process of cutting the groove.It is believed that the measurement (in inches)of the groove width is Normally distributed.Over a period of time,20 samples,each of size n = 5,were selected in order to establish 3-sigma  and s charts.From these samples the following were determined:
  = 0.15932 and
  = 0.0193438.Examination of the
  chart and the s chart for the samples led to the conclusion that the process was in control at this time.What,then,are the estimates of the process mean,,and process standard deviation,?
(Multiple Choice)
4.9/5  (42)
(42)
It is said that "the first step to improving a process is to understand it." Which of the following may be helpful in gaining an understanding of the process?
(Multiple Choice)
4.9/5 (32)
Parts manufactured by an injection molding process are subjected to a compressive strength test.We monitor the compressive strength of the parts manufactured by this process using an  and an s control chart.Samples of size 9 are taken at regular intervals,and their mean compressive strength (in psi = pounds per square inch)and standard deviation are plotted on the charts in time order.The overall mean of the sample means is
  = 81.2 psi,and the mean of the sample standard deviations is
  = 2.9 psi.The control chart constants are (partially)reproduced below.
  What is the value of the center line for the
  chart?
(Multiple Choice)
4.9/5 (40)
Parts manufactured by an injection molding process are subjected to a compressive strength test.We monitor the compressive strength of the parts manufactured by this process using an  and an s control chart.Samples of size 9 are taken at regular intervals,and their mean compressive strength (in psi = pounds per square inch)and standard deviation are plotted on the charts in time order.The overall mean of the sample means is
  = 81.2 psi,and the mean of the sample standard deviations is
  = 2.9 psi.The control chart constants are (partially)reproduced below.
 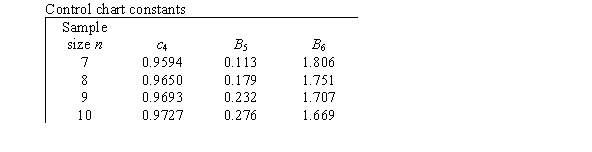 What is the center line for the s chart?
(Multiple Choice)
4.8/5 (39)
What is the name of a chart in which the standard deviations of samples taken at regular intervals are plotted against the time order in which the samples were taken?
(Multiple Choice)
4.7/5 (48)
A random sample of items was selected from all items produced in a day of production.Each item was examined to determine if the item conformed to the customer's specifications.This was repeated over 20 days with a sample of 150 items chosen each day.At the end of the 20 days,it was determined that a total of 69 items failed and were declared to be nonconforming.The following chart,which shows the proportion of nonconforming items for each day,was produced. 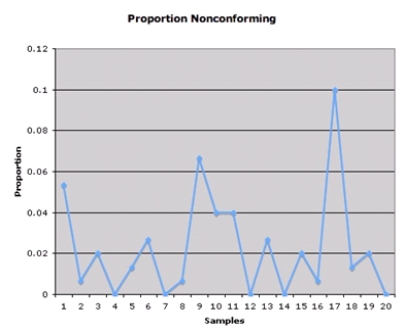 From the chart,what can be said about the process at this point?
(Essay)
4.9/5 (44)
A variable is measured periodically on a process.Suppose the variable continues to be described by the same distribution when observed over time.What can we say about this variable?
(Multiple Choice)
5.0/5 (35)
You have been invited to give a special address at the Joint Statistics Meeting on your research area.You are allotted 1 hour to give your talk.You practice your talk many times in order to make sure it is perfect and within the time constraints.What is a special cause variation for the length of the talk?
(Multiple Choice)
4.7/5 (34)
Which of the following is an example of special cause variation?
(Multiple Choice)
4.7/5 (28)
Piston rings for an automotive engine are produced by a forging process.We wish to monitor the inside diameter of the rings manufactured by this process using an  and an s control chart.Samples of size 4 are to be taken at regular intervals,and the sample means and standard deviations are computed and plotted on the charts in time order.The target values for the inside diameter are a mean of = 75 millimeters and a standard deviation of = 0.02 millimeters.The control chart constants are (partially)reproduced below.
  What is the center line for the s chart?
(Multiple Choice)
4.9/5 (30)
Piston rings for an automotive engine are produced by a forging process.We monitor the inside diameter of the rings manufactured by this process using an  and an s control chart.Samples of size 4 are taken at regular intervals,and the sample means and standard deviations are computed and plotted on the charts in time order.The overall mean of the sample means is
  = 73.97 millimeters,and the sample standard deviation of all measurements is s = 0.03 millimeters.Specifications call for the inside diameter of the rings to be 74.00 ± 0.10 millimeters.The control chart constants are (partially)reproduced below.
 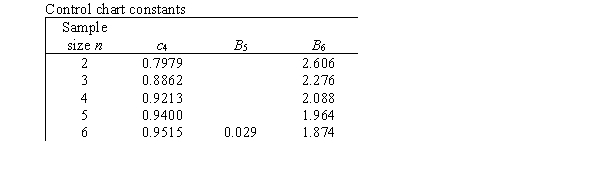 What is the value of an estimate of the capability index Cp?
(Multiple Choice)
5.0/5 (38)
Parts manufactured by an injection molding process are subjected to a compressive strength test.We wish to monitor the compressive strength of the parts manufactured by this process using both  and s charts.Samples of size 9 are to be taken at regular intervals,and their mean compressive strength (in psi = pounds per square inch)and standard deviation are plotted on the charts in time order.The target values for the compressive strengths are a mean of = 80 psi and a standard deviation of = 3 psi.The control chart constants are (partially)reproduced below.
  What is the upper control limit for the s chart?
(Multiple Choice)
4.8/5 (42)
Which of the following is an example of a process that is in control but does not have capability?
(Multiple Choice)
4.8/5 (41)
At the start of the semester,a professor wants to monitor students who miss class.The professor implements a new attendance policy geared toward encouraging students to attend class every day.There are currently 150 registered students in the class,and each day the class takes a quiz that is just used to measure attendance.The number of quizzes that are turned in will serve as the measure of attendance.The quizzes are given at every class period and the class meets four times per week over a 15-week semester.Would creating a single p chart be useful for this situation with all students and the number of days missed on the same chart?
(Multiple Choice)
4.8/5 (39)
Piston rings for an automotive engine are produced by a forging process.We monitor the inside diameter of the rings manufactured by this process using an  and an s control chart.Samples of size 4 are taken at regular intervals,and the sample means and standard deviations are computed and plotted on the charts in time order.The overall mean of the sample means is 73.812 millimeters,and the mean of the sample standard deviations is 0.022 millimeters.The control chart constants are (partially)reproduced below.
  What is the lower control limit for the s chart?
(Multiple Choice)
4.9/5 (35)
Filters
- Essay(0)
- Multiple Choice(0)
- Short Answer(0)
- True False(0)
- Matching(0)