Exam 17: Statistics for Quality: Control and Capability
Exam 1: Looking at Datadistributions127 Questions
Exam 2: Looking at Datarelationships48 Questions
Exam 3: Producing Data70 Questions
Exam 4: Probability: the Study of Randomness93 Questions
Exam 5: Sampling Distributions77 Questions
Exam 6: Introduction to Inference89 Questions
Exam 7: Inference for Means103 Questions
Exam 8: Inference for Proportions101 Questions
Exam 9: Inference for Categorical Data122 Questions
Exam 10: Inference for Regression91 Questions
Exam 11: Multiple Regression95 Questions
Exam 12: One-Way Analysis of Variance74 Questions
Exam 13: Two-Way Analysis of Variance53 Questions
Exam 14: Logistic Regression53 Questions
Exam 15: Nonparametric Tests57 Questions
Exam 16: Bootstrap Methods and Permutation Tests42 Questions
Exam 17: Statistics for Quality: Control and Capability86 Questions
Select questions type
At the start of the semester,a professor wants to monitor students who miss class.The professor implements a new attendance policy geared toward encouraging students to attend class every day.There are currently 150 registered students in the class,and each day the class takes a quiz that is just used to measure attendance.The number of quizzes that are turned in will serve as the measure of attendance.The quizzes are given at every class period and the class meets four times per week over a 15-week semester.What is the value of the UCL?
(Multiple Choice)
4.9/5  (40)
(40)
Under what circumstances will the process capability indexes  and
and  be equal?
(Multiple Choice)
4.9/5 (31)
The data below represent the means from 15 sample control charts for the amount of time in minutes it takes students to complete a quiz in a basic statistics course.The same quiz was given to 15 different sections of a basic statistics course.Five students were sampled from each class and each mean is shown below. 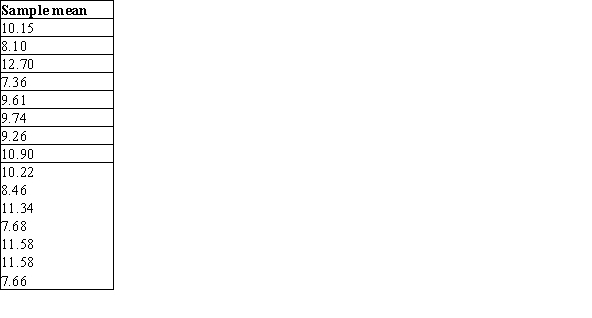 What is the value of the lower control limit?
(Multiple Choice)
4.8/5 (39)
The _______ the value of Cp or Cpk,the more _____ the process.
(Multiple Choice)
4.8/5 (40)
An important characteristic in the proper operation of ignition keys for automobiles is the groove width of the key.In a large manufacturing plant that produces thousands of keys,control charts have been established to monitor the process of cutting the groove.It is believed that the measurement (in inches)of the groove width is Normally distributed.Over a period of time,20 samples,each of size n = 5,were selected in order to establish 3-sigma  and s charts.From these samples the following were determined:
  = 0.15932 and
  = 0.0193438.What is the value of the center line on the
  chart and on the s chart,respectively?
(Multiple Choice)
4.9/5 (27)
Suppose we use a "run of eight" rule;that is,we declare the process out of control if eight consecutive points are all above the center line of the  chart or if eight consecutive points are all below the center line of the
  Chart.If the process is in statistical control,what is the (approximate)probability that we declare the process out of control using this rule?
(Multiple Choice)
4.7/5 (31)
Piston rings for an automotive engine are produced by a forging process.We wish to monitor the inside diameter of the rings manufactured by this process using an  and an s control chart.Samples of size 4 are to be taken at regular intervals,and the sample means and standard deviations are computed and plotted on the charts in time order.The target values for the inside diameter are a mean of = 75 millimeters and a standard deviation of = 0.02 millimeters.The control chart constants are (partially)reproduced below.
  What is the upper control limit for the
  Chart?
(Multiple Choice)
4.8/5 (34)
In an electronics company that produces transistors,1000 transistors are inspected at regular intervals.The proportion of nonconforming transistors produced by the process,estimated from data collected in a 1-month period,is  = 0.0026.What would be the value of the lower control limit for a p chart of future samples of size 10,000?
(Multiple Choice)
4.8/5 (37)
The data below represent the means from 15 sample control charts for the amount of time in minutes it takes students to complete a quiz in a basic statistics course.The same quiz was given to 15 different sections of a basic statistics course.Five students were sampled from each class and each mean is shown below.  What is the value of the upper control limit?
(Multiple Choice)
4.9/5 (33)
Which of the following statements about the use of control charts is/are FALSE?
(Multiple Choice)
4.8/5 (39)
In an electronics company that produces transistors,1000 transistors are inspected at regular intervals.The proportion of nonconforming transistors produced by the process,estimated from data collected in a 1-month period,is  = 0.0026.What would be the value of the center line for a p chart of future samples of size 1000?
(Multiple Choice)
4.9/5 (38)
A control chart on a process characteristic has been shown to be in control.It has been determined that the process characteristic is approximately Normally distributed with an estimated mean  = 36.5 and standard deviation
  = 1.25.The customer has indicated that the output from the process is acceptable if the measured characteristic is between a lower specification limit of 30 and an upper specification limit of 40.What are the estimated values of
  and
and  ,respectively,for this process output?
(Multiple Choice)
4.7/5 (34)
Piston rings for an automotive engine are produced by a forging process.We wish to monitor the inside diameter of the rings manufactured by this process using an  and an s control chart.Samples of size 4 are to be taken at regular intervals,and the sample means and standard deviations are computed and plotted on the charts in time order.The target values for the inside diameter are a mean of = 75 millimeters and a standard deviation of = 0.02 millimeters.The control chart constants are (partially)reproduced below.
  What is the center line for the
  Chart?
(Multiple Choice)
4.9/5 (33)
At the start of the semester,a professor wants to monitor students who miss class.The professor implements a new attendance policy geared toward encouraging students to attend class every day.There are currently 150 registered students in the class,and each day the class takes a quiz that is just used to measure attendance.The number of quizzes that are turned in will serve as the measure of attendance.The quizzes are given at every class period and the class meets four times per week over a 15-week semester.Suppose there were a total of 510 absences throughout this process.What is the average daily proportion absent?
(Multiple Choice)
4.9/5 (38)
Which of the following would produce an out-of-control signal in a control chart?
(Multiple Choice)
4.7/5 (33)
Which of the following is true about processes that are in control?
(Multiple Choice)
4.9/5 (36)
Piston rings for an automotive engine are produced by a forging process.We monitor the inside diameter of the rings manufactured by this process using an  and an s control chart.Samples of size 4 are taken at regular intervals,and the sample means and standard deviations are computed and plotted on the charts in time order.The overall mean of the sample means is 73.812 millimeters,and the mean of the sample standard deviations is 0.022 millimeters.The control chart constants are (partially)reproduced below.
 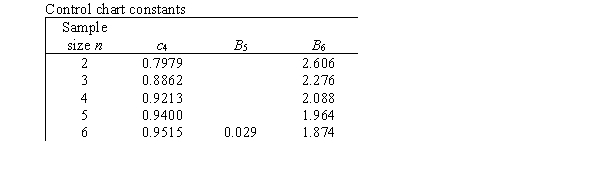 What is the value of the center line of the s chart?
(Multiple Choice)
4.7/5 (41)
A bank is interested in improving the time it takes to complete transactions at teller windows.The goal is to have no transaction take more than 5 minutes.What name do we give the quantity "5 minutes"?
(Multiple Choice)
4.9/5 (39)
Filters
- Essay(0)
- Multiple Choice(0)
- Short Answer(0)
- True False(0)
- Matching(0)