Exam 17: Statistics for Quality: Control and Capability
Exam 1: Looking at Datadistributions127 Questions
Exam 2: Looking at Datarelationships48 Questions
Exam 3: Producing Data70 Questions
Exam 4: Probability: the Study of Randomness93 Questions
Exam 5: Sampling Distributions77 Questions
Exam 6: Introduction to Inference89 Questions
Exam 7: Inference for Means103 Questions
Exam 8: Inference for Proportions101 Questions
Exam 9: Inference for Categorical Data122 Questions
Exam 10: Inference for Regression91 Questions
Exam 11: Multiple Regression95 Questions
Exam 12: One-Way Analysis of Variance74 Questions
Exam 13: Two-Way Analysis of Variance53 Questions
Exam 14: Logistic Regression53 Questions
Exam 15: Nonparametric Tests57 Questions
Exam 16: Bootstrap Methods and Permutation Tests42 Questions
Exam 17: Statistics for Quality: Control and Capability86 Questions
Select questions type
Parts manufactured by an injection molding process are subjected to a compressive strength test.We monitor the compressive strength of the parts manufactured by this process using an  and an s control chart.Samples of size 9 are taken at regular intervals,and their mean compressive strength (in psi = pounds per square inch)and standard deviation are plotted on the charts in time order.The overall mean of the sample means is
  = 81.2 psi,and the sample standard deviation of all measurements is s = 3.0 psi.Specifications call for the compressive strength of parts to be 80 ± 2.5 psi.The control chart constants are (partially)reproduced below.
  What is the value of an estimate of the capability index Cpk?
(Multiple Choice)
4.8/5  (36)
(36)
Which of the following is TRUE of the capability index Cpk?
(Multiple Choice)
4.8/5 (30)
Piston rings for an automotive engine are produced by a forging process.We monitor the inside diameter of the rings manufactured by this process using an  and an s control chart.Samples of size 4 are taken at regular intervals,and the sample means and standard deviations are computed and plotted on the charts in time order.The overall mean of the sample means is 73.812 millimeters,and the mean of the sample standard deviations is 0.022 millimeters.The control chart constants are (partially)reproduced below.
 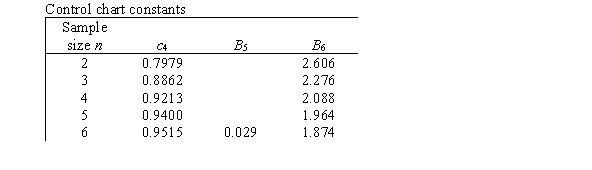 The overall mean of the sample means is given as 73.812 millimeters.What symbol do we use to represent this value?
(Multiple Choice)
4.9/5 (39)
Cp and Cpk are very useful whether or not the measurements on the process outputs come from an approximately Normal distribution.
(True/False)
5.0/5 (39)
Parts manufactured by an injection molding process are subjected to a compressive strength test.We monitor the compressive strength of the parts manufactured by this process using an  and an s control chart.Samples of size 9 are taken at regular intervals,and their mean compressive strength (in psi = pounds per square inch)and standard deviation are plotted on the charts in time order.The overall mean of the sample means is
  = 81.2 psi,and the sample standard deviation of all measurements is s = 3.0 psi.Specifications call for the compressive strength of parts to be 80 ± 2.5 psi.The control chart constants are (partially)reproduced below.
 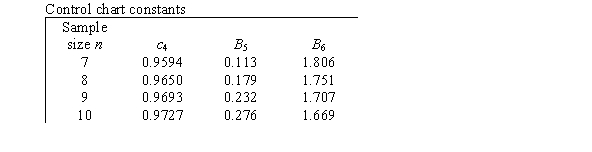 What is the value of an estimate of the capability index Cp?
(Multiple Choice)
4.8/5 (28)
Parts manufactured by an injection molding process are subjected to a compressive strength test.We monitor the compressive strength of the parts manufactured by this process using an  and an s control chart.Samples of size 9 are taken at regular intervals,and their mean compressive strength (in psi = pounds per square inch)and standard deviation are plotted on the charts in time order.The overall mean of the sample means is
  = 81.2 psi,and the mean of the sample standard deviations is
  = 2.9 psi.The control chart constants are (partially)reproduced below.
  What is the lower control limit for the
  chart?
(Multiple Choice)
4.9/5 (30)
The data below represent the means from 15 sample control charts for the amount of time in minutes it takes students to complete a quiz in a basic statistics course.The same quiz was given to 15 different sections of a basic statistics course.Five students were sampled from each class and each mean is shown below. 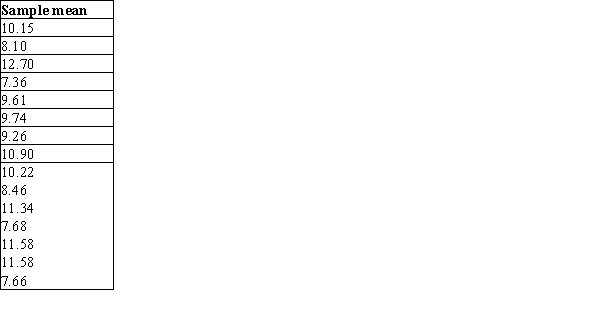 Which graph is the control chart for
  ?
?
(Multiple Choice)
4.7/5 (41)
The sampling distribution of  under the process-monitoring condition is __________.
(Multiple Choice)
4.8/5 (39)
At the start of the semester,a professor wants to monitor students who miss class.The professor implements a new attendance policy geared toward encouraging students to attend class every day.There are currently 150 registered students in the class,and each day the class takes a quiz that is just used to measure attendance.The number of quizzes that are turned in will serve as the measure of attendance.The quizzes are given at every class period and the class meets four times per week over a 15-week semester.What is the value of the LCL?
(Multiple Choice)
4.8/5 (33)
Parts manufactured by an injection molding process are subjected to a compressive strength test.We wish to monitor the compressive strength of the parts manufactured by this process using both  and s charts.Samples of size 9 are to be taken at regular intervals,and their mean compressive strength (in psi = pounds per square inch)and standard deviation are plotted on the charts in time order.The target values for the compressive strengths are a mean of = 80 psi and a standard deviation of = 3 psi.The control chart constants are (partially)reproduced below.
  Suppose at the time of sample 10,we observe a mean of 85 psi.What should we do?
(Multiple Choice)
4.8/5 (32)
An automobile dealer checks on the quality of the service department by keeping a log of customer complaints and incidents of repeat service.Regular samples of 25 customers are taken,and based on these data the process proportion of customer complaints and incidences of repeat service is estimated to be  = 0.072.What would be the value of the upper control limit for a p chart of future samples of size 25?
(Multiple Choice)
4.9/5 (37)
Out of control signals are produced from control charts when __________.
(Multiple Choice)
4.9/5 (39)
The capability index  can be very informative and useful even if the sample size is small.
(True/False)
4.9/5 (45)
Suppose you are the owner of a new boutique hotel.It generally takes your staff 4 minutes with a standard deviation of 0.5 minute to check guests into their rooms.Currently the process is stable;however it is your goal to be able to check guests in within 3 minutes of their arrival.What is the value of Cpk?
(Multiple Choice)
4.8/5 (44)
You have been invited to give a special address at the Joint Statistics Meeting on your research area.You are allotted 1 hour to give your talk.You practice your talk many times in order to make sure it is perfect and within the time constraints.What is the common cause variation for the length of the talk?
(Multiple Choice)
4.9/5 (44)
A statistic Q is to be used to monitor a process over time,using a control chart for that statistic.When the process is running in a state of control,it is known that the statistic Q has mean  and standard deviation
  .Which of the following is NOT a feature of the appropriate three-sigma control chart for Q?
(Multiple Choice)
4.8/5 (32)
At the start of the semester,a professor wants to monitor students who miss class.The professor implements a new attendance policy geared toward encouraging students to attend class every day.There are currently 150 registered students in the class,and each day the class takes a quiz that is just used to measure attendance.The number of quizzes that are turned in will serve as the measure of attendance.The quizzes are given at every class period and the class meets four times per week over a 15-week semester.How many person-days are there for this process?
(Multiple Choice)
4.9/5 (45)
Parts manufactured by an injection molding process are subjected to a compressive strength test.We wish to monitor the compressive strength of the parts manufactured by this process using both  and s charts.Samples of size 9 are to be taken at regular intervals,and their mean compressive strength (in psi = pounds per square inch)and standard deviation are plotted on the charts in time order.The target values for the compressive strengths are a mean of = 80 psi and a standard deviation of = 3 psi.The control chart constants are (partially)reproduced below.
  What is the center line for the s chart?
(Multiple Choice)
4.8/5 (42)
Filters
- Essay(0)
- Multiple Choice(0)
- Short Answer(0)
- True False(0)
- Matching(0)