Exam 11: Multiple Regression
Exam 1: Looking at Datadistributions127 Questions
Exam 2: Looking at Datarelationships48 Questions
Exam 3: Producing Data70 Questions
Exam 4: Probability: the Study of Randomness93 Questions
Exam 5: Sampling Distributions77 Questions
Exam 6: Introduction to Inference89 Questions
Exam 7: Inference for Means103 Questions
Exam 8: Inference for Proportions101 Questions
Exam 9: Inference for Categorical Data122 Questions
Exam 10: Inference for Regression91 Questions
Exam 11: Multiple Regression95 Questions
Exam 12: One-Way Analysis of Variance74 Questions
Exam 13: Two-Way Analysis of Variance53 Questions
Exam 14: Logistic Regression53 Questions
Exam 15: Nonparametric Tests57 Questions
Exam 16: Bootstrap Methods and Permutation Tests42 Questions
Exam 17: Statistics for Quality: Control and Capability86 Questions
Select questions type
Data were obtained in a study of the oxygen uptake of 31 middle-aged-males and females while exercising.The researchers were interested in the use of a variety of variables as predictors of Oxygen Uptake.The variables that were measured on the subjects were Age,Weight,the time taken to run a specified distance (Runtime),pulse rate at the end of the run (RunPulse),their resting pulse rate (RstPulse),and their maximum pulse rate during the run (MaxPulse).The following table from a computer analysis of the data is provided (with some entries deleted and replaced by **).  What is the value of the F statistic and the associated degrees of freedom for the test?
(Multiple Choice)
4.9/5  (33)
(33)
________ happens when variables in a multiple regression model are too highly correlated with each other.
(Multiple Choice)
4.8/5 (29)
Many people believe that parents' marital status influences their child's development throughout life and has a large effect on their child's skill in sports.A survey was sent to 100 students who were in athletics in college.Responses from 35 students were received.The researchers were interested in determining whether the marital status and level of happiness of the students' parents would predict the student's self-rated skill level in a sport.The statistical model for the multiple linear regression is in the form of which of the following? (Note: assume i = 1 to n,where n is the number of cases. )
(Multiple Choice)
4.9/5 (39)
Malaria is a leading cause of infectious disease and death worldwide.It is also a popular example of a vector-borne disease that could be greatly affected by the influence of climate change.A study was done to determine the relationship between reported malaria cases in West Africa and several weather variables (for example,mean temperature (°C),dew point (°C),maximum temperature (°C),minimum temperature (°C),and total precipitation (mm)).The data were collected over a 10-year period.Below are the results of a correlation analysis with all considered variables.The Pearson correlation coefficients are displayed as the top value.The P-value for the test of the null hypothesis that the population correlation is zero versus the two-sided alternative is the bottom value. 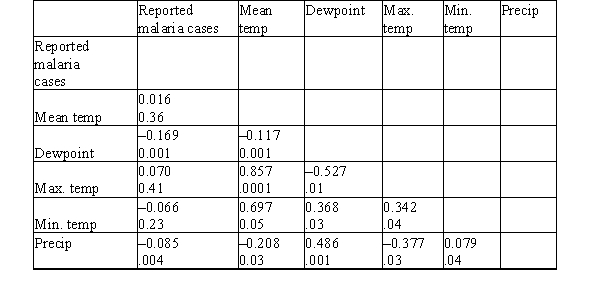 Is the correlation between reported malaria cases and maximum temperature statistically significant?
(Multiple Choice)
5.0/5 (33)
A researcher is investigating possible explanations for deaths in traffic accidents.He examined data from 1991 for each of the 50 states plus Washington,DC.The data included information on the following variables. 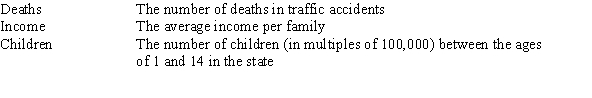 As part of his investigation he ran the multiple regression model, Deaths = 0 + 1(Children)+ 2(Income)+ i,
Where the deviations i were assumed to be independent and Normally distributed with a mean of 0 and a standard deviation of .This model was fit to the data using the method of least squares.The following results were obtained from statistical software.
As part of his investigation he ran the multiple regression model, Deaths = 0 + 1(Children)+ 2(Income)+ i,
Where the deviations i were assumed to be independent and Normally distributed with a mean of 0 and a standard deviation of .This model was fit to the data using the method of least squares.The following results were obtained from statistical software. 
 Suppose we wish to test the hypotheses H0: 1 = 2 = 0 versus Ha: at least one of the j is not 0 using the ANOVA F test.What is the value of the F statistic?
(Multiple Choice)
4.9/5 (38)
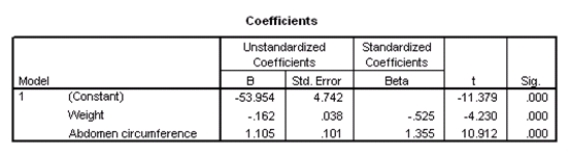
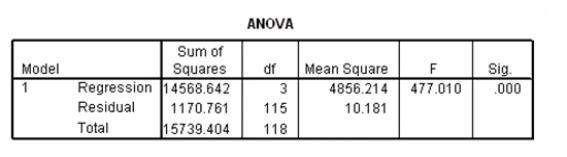
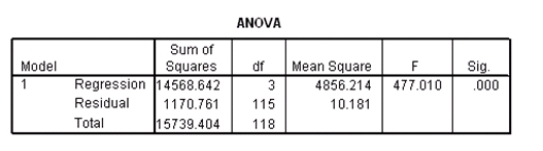
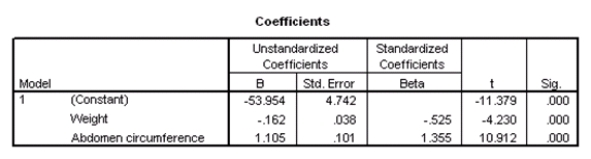
Researchers at a large nutrition and weight management company are trying to build a model to predict a person's body fat percentage from an array of variables such as body weight,height,and body measurements around the neck,chest,abdomen,hips,biceps,etc.A variable selection method is used to build a simple model.SPSS output for the final model is given below. 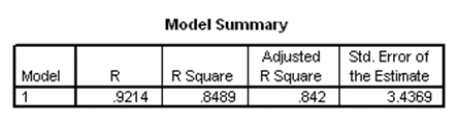

 Suppose we wish to test the hypotheses H0: 1 = 2 = 0 versus Ha: at least one of the j is not 0,using the ANOVA F test.What is the value of the test statistic?
(Multiple Choice)
4.8/5 (44)
Malaria is a leading cause of infectious disease and death worldwide.It is also a popular example of a vector-borne disease that could be greatly affected by the influence of climate change.A study was done to determine the relationship between reported malaria cases in West Africa and several weather variables (for example,mean temperature (°C),dew point (°C),maximum temperature (°C),minimum temperature (°C),and total precipitation (mm)).The data were collected over a 10-year period.Below are the results of a correlation analysis with all considered variables.The Pearson correlation coefficients are displayed as the top value.The P-value for the test of the null hypothesis that the population correlation is zero versus the two-sided alternative is the bottom value.  Which variable has the weakest correlation with the reported malaria cases?
(Multiple Choice)
4.8/5 (32)
Data were obtained in a study of the oxygen uptake of 31 middle-aged-males and females while exercising.The researchers were interested in the use of a variety of variables as predictors of Oxygen Uptake.The variables that were measured on the subjects were Age,Weight,the time taken to run a specified distance (Runtime),pulse rate at the end of the run (RunPulse),their resting pulse rate (RstPulse),and their maximum pulse rate during the run (MaxPulse).The following table from a computer analysis of the data is provided (with some entries deleted and replaced by **). 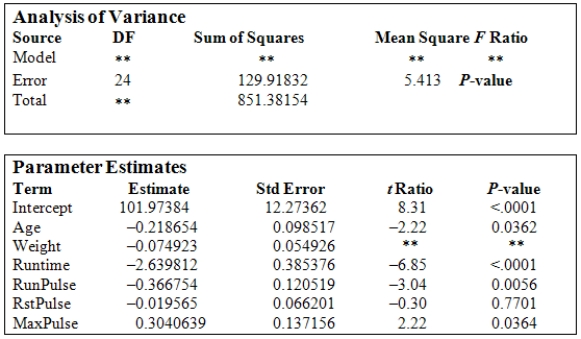 Under H0:
  against Ha:
  to test the significance of the variable Weight,what are the values of the test statistic and the P-value of the test?
(Multiple Choice)
4.8/5 (39)
Researchers at a car resale company are trying to build a model to predict a car's 4-year resale value (in thousands of dollars)from several predictor variables.The variables they selected are as below.  Data were collected on cars of different models made by different manufacturers.SPSS output for the least-squares regression model is given below.
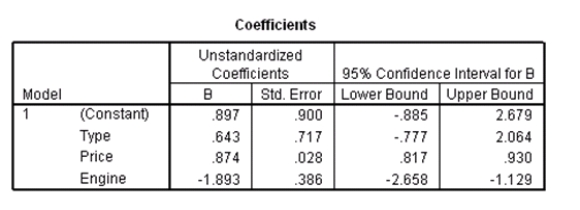 An F test for the two coefficients of type and engine is performed.The hypotheses areH0: 1 = 3 = 0 versus Ha: at least one of the j is not 0.The F statistic for this test is 12.21 with 2 and 115 degrees of freedom.Do we reject the null hypothesis at the 5% significance level?
(Short Answer)
4.7/5 (27)
Data were obtained in a study of the oxygen uptake of 31 middle-aged-males and females while exercising.The researchers were interested in the use of a variety of variables as predictors of Oxygen Uptake.The variables that were measured on the subjects were Age,Weight,the time taken to run a specified distance (Runtime),pulse rate at the end of the run (RunPulse),their resting pulse rate (RstPulse),and their maximum pulse rate during the run (MaxPulse).The following table from a computer analysis of the data is provided (with some entries deleted and replaced by **).  What is the mean square for model (MSM)?
(Multiple Choice)
4.9/5 (39)
Researchers at a car resale company are trying to build a model to predict a car's 4-year resale value (in thousands of dollars)from several predictor variables.The variables they selected are as below.  Data were collected on cars of different models made by different manufacturers.SPSS output for the least-squares regression model is given below.
 Suppose we wish to test the hypotheses H0: 1 = 0 versus Ha: 1 0,where 1 is the coefficient for the variable type.Based on the 95% confidence interval given in the output,what do we know about the value of the P-value of this test?
(Short Answer)
4.9/5 (36)
The data referred to in this question were collected from several sales districts across the country.The data represent sales for a maker of asphalt roofing shingles.Information on the following variables is available. 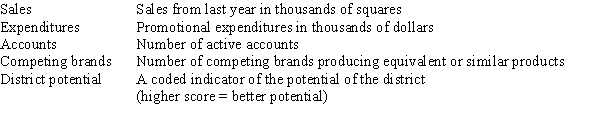 Partial SPSS regression output of a multiple regression model with sales as the response variable and the other four variables as predictor variables are given below.
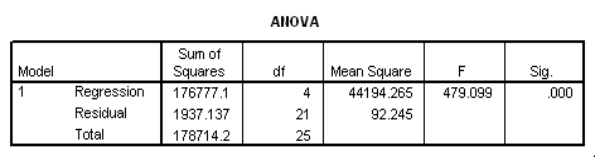
 What is the estimate for the error variance 2?
(Multiple Choice)
4.7/5 (35)
Many people believe that parents' marital status influences their child's development throughout life and has a large effect on their child's skill in sports.A survey was sent to 100 students who were in athletics in college.Responses from 35 students were received.The researchers were interested in determining whether the marital status and level of happiness of the students' parents would predict the student's self-rated skill level in a sport.What is the response variable in this study?
(Multiple Choice)
5.0/5 (37)
Researchers at a car resale company are trying to build a model to predict a car's 4-year resale value (in thousands of dollars)from several predictor variables.The variables they selected are as below.  Data were collected on cars of different models made by different manufacturers.SPSS output for the least-squares regression model is given below.

 A Normal quantile plot of the residuals is given below.
 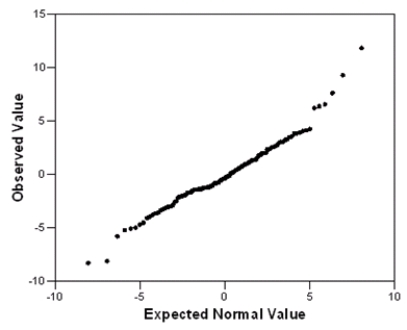 What assumption do we check with this graph,and does the assumption seem to be satisfied?
(Essay)
4.8/5 (32)
A researcher is investigating possible explanations for deaths in traffic accidents.He examined data from 1991 for each of the 50 states plus Washington,DC.The data included information on the following variables.  As part of his investigation he ran the multiple regression model, Deaths = 0 + 1(Children)+ 2(Income)+ i,
Where the deviations i were assumed to be independent and Normally distributed with a mean of 0 and a standard deviation of .This model was fit to the data using the method of least squares.The following results were obtained from statistical software.
As part of his investigation he ran the multiple regression model, Deaths = 0 + 1(Children)+ 2(Income)+ i,
Where the deviations i were assumed to be independent and Normally distributed with a mean of 0 and a standard deviation of .This model was fit to the data using the method of least squares.The following results were obtained from statistical software. 
 The researcher also ran the simple linear regression model
Deaths = 0 + 2(Income)+ i.
The following results were obtained from statistical software:
The researcher also ran the simple linear regression model
Deaths = 0 + 2(Income)+ i.
The following results were obtained from statistical software: 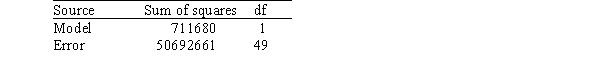
 Based on the analyses,what can we conclude?
(Multiple Choice)
4.8/5 (36)
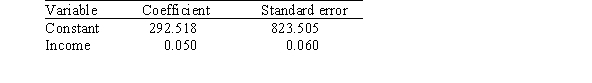
A researcher is investigating variables that might be associated with the academic performance of high school students.She examined data from 1990 for each of the 50 states plus Washington,DC.The data included information on the following variables. 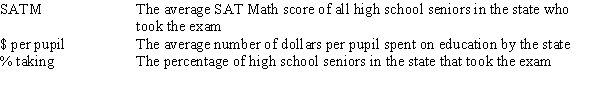 As part of her investigation,she ran the multiple regression model SATM = 0 + 1($ per pupil)+ 2(% taking)+ i,
Where the deviations i were assumed to be independent and Normally distributed with a mean of 0 and a standard deviation of .This model was fit to the data using the method of least squares.The following results were obtained from statistical software.
As part of her investigation,she ran the multiple regression model SATM = 0 + 1($ per pupil)+ 2(% taking)+ i,
Where the deviations i were assumed to be independent and Normally distributed with a mean of 0 and a standard deviation of .This model was fit to the data using the method of least squares.The following results were obtained from statistical software. 
 Suppose we wish to test the hypotheses H0: 1 = 2 = 0 versus Ha: at least one of the j is not 0,using the ANOVA F test.What is the value of the F statistic?
(Multiple Choice)
4.8/5 (40)
Data were obtained in a study of the oxygen uptake of 31 middle-aged-males and females while exercising.The researchers were interested in the use of a variety of variables as predictors of Oxygen Uptake.The variables that were measured on the subjects were Age,Weight,the time taken to run a specified distance (Runtime),pulse rate at the end of the run (RunPulse),their resting pulse rate (RstPulse),and their maximum pulse rate during the run (MaxPulse).The following table from a computer analysis of the data is provided (with some entries deleted and replaced by **). 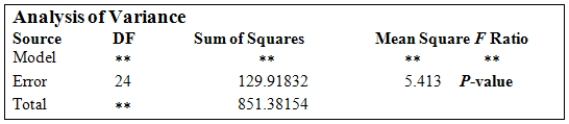 The degrees of freedom for model (DFM)and total (DFT)are
(Multiple Choice)
4.8/5 (26)
The data referred to in this question were collected from several sales districts across the country.The data represent sales for a maker of asphalt roofing shingles.Information on the following variables is available.  Partial SPSS regression output of a multiple regression model with sales as the response variable and the other four variables as predictor variables are given below.
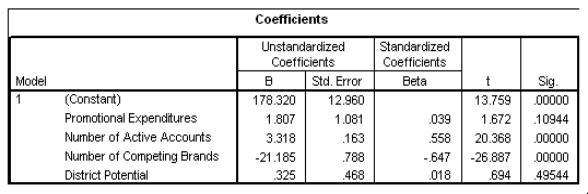
 Which of the four explanatory variables seems to be the least significant in the model?
(Multiple Choice)
4.9/5 (32)
Researchers at a large nutrition and weight management company are trying to build a model to predict a person's body fat percentage from an array of variables such as body weight,height,and body measurements around the neck,chest,abdomen,hips,biceps,etc.A variable selection method is used to build a simple model.SPSS output for the final model is given below. 
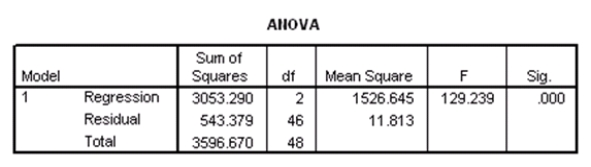
 What is the value of an estimate of 2?
(Multiple Choice)
4.9/5 (37)
A researcher is investigating possible explanations for deaths in traffic accidents.He examined data from 1991 for each of the 50 states plus Washington,DC.The data included information on the following variables.  As part of his investigation he ran the multiple regression model, Deaths = 0 + 1(Children)+ 2(Income)+ i,
Where the deviations i were assumed to be independent and Normally distributed with a mean of 0 and a standard deviation of .This model was fit to the data using the method of least squares.The following results were obtained from statistical software.
As part of his investigation he ran the multiple regression model, Deaths = 0 + 1(Children)+ 2(Income)+ i,
Where the deviations i were assumed to be independent and Normally distributed with a mean of 0 and a standard deviation of .This model was fit to the data using the method of least squares.The following results were obtained from statistical software. 
 The researcher also ran the simple linear regression model
Deaths = 0 + 2(Income)+ i.
The following results were obtained from statistical software:
The researcher also ran the simple linear regression model
Deaths = 0 + 2(Income)+ i.
The following results were obtained from statistical software: 
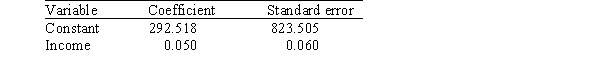 What is the value of R2 in the simple linear regression model?
(Multiple Choice)
4.8/5 (33)
Filters
- Essay(0)
- Multiple Choice(0)
- Short Answer(0)
- True False(0)
- Matching(0)