Exam 11: Multiple Regression
Exam 1: Looking at Datadistributions127 Questions
Exam 2: Looking at Datarelationships48 Questions
Exam 3: Producing Data70 Questions
Exam 4: Probability: the Study of Randomness93 Questions
Exam 5: Sampling Distributions77 Questions
Exam 6: Introduction to Inference89 Questions
Exam 7: Inference for Means103 Questions
Exam 8: Inference for Proportions101 Questions
Exam 9: Inference for Categorical Data122 Questions
Exam 10: Inference for Regression91 Questions
Exam 11: Multiple Regression95 Questions
Exam 12: One-Way Analysis of Variance74 Questions
Exam 13: Two-Way Analysis of Variance53 Questions
Exam 14: Logistic Regression53 Questions
Exam 15: Nonparametric Tests57 Questions
Exam 16: Bootstrap Methods and Permutation Tests42 Questions
Exam 17: Statistics for Quality: Control and Capability86 Questions
Select questions type
Based on a sample of the salaries of professors at a major university,you have performed a multiple linear regression relating salary to years of service and gender.The data included information on the following variables.  The estimated multiple linear regression model is Salary = 45 + 3(Years)+ 4(Gender)+ 1(Years)(Gender).
A particular female professor with 6 years of experience currently has a salary of $60,000.What is the residual for this observation?
The estimated multiple linear regression model is Salary = 45 + 3(Years)+ 4(Gender)+ 1(Years)(Gender).
A particular female professor with 6 years of experience currently has a salary of $60,000.What is the residual for this observation?
(Multiple Choice)
4.9/5  (36)
(36)
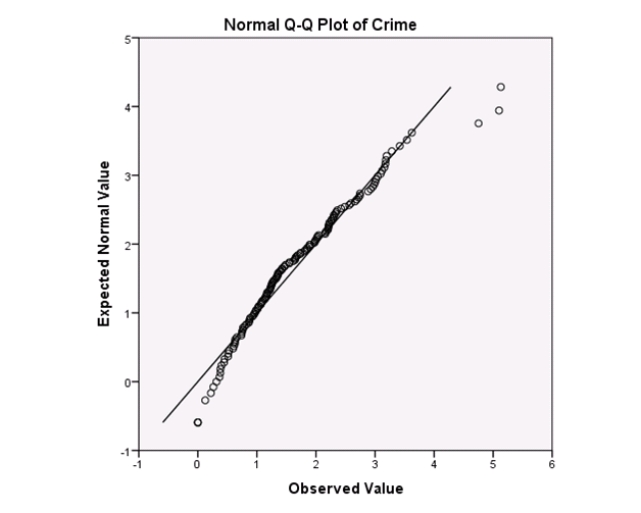
Campus crime rates are generally lower than the national average;however thousands of crimes take place on college campuses daily.Cities that are notoriously dangerous would likely be undesirable locations for a college campus.A study examined the crime rates on campuses throughout the United States and whether or not they were significantly affected by surrounding cities.A regression analysis was performed to investigate which characteristics of a city,along with a few chosen demographics of a school,impacted the crime rate on a college campus.There are over 4000 colleges and universities in the United States.The study included a random sample of 129 institutions.The response variable was the number of crimes per 1000 people.Explanatory variables included the percent of married couples in the city (married),tuition of the university (tuition),average income of the city (income),unemployment rate of the city (unemployment),percent of students who belong to a fraternity or sorority (Greek),average age of the students at the university (age),and number of liquor stores in the city (liquor).A complete analysis of the data is shown below. 


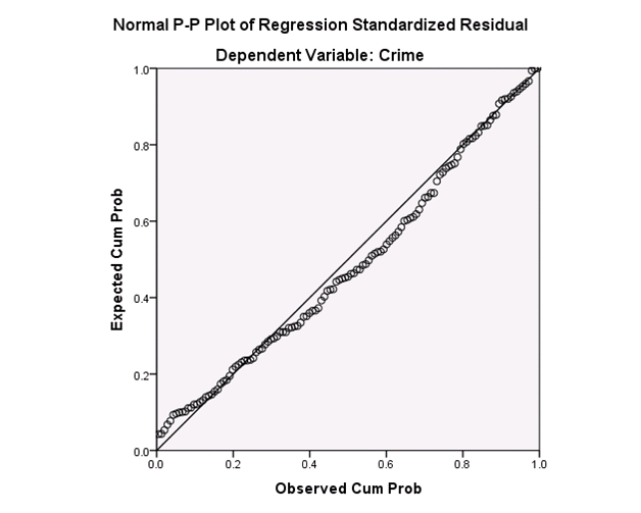 Examine the Q-Q plot of the residuals.What do you notice?
(Multiple Choice)
4.9/5 (40)
A study was conducted on 40 different brands of golf balls with respect to the distance the ball traveled after being struck with standardized test 7-iron.The response variable DIST is the measurement of the carry distance of the shot in yards.The explanatory variables are SMASH,the ratio of the ball speed/club speed at impact;SPIN,the initial spin rate of the ball in RPMs;and HEIGHT,the peak height of the ball in flight measured in feet. The following is a table showing some computer output (missing results are shown by **)for a least-squares fit of a multiple regression model using these variables. 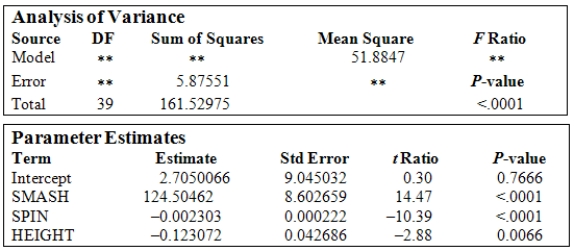 What is the value of the squared multiple correlation
  ?
?
(Multiple Choice)
4.9/5 (42)
Suppose you want to perform a multiple linear regression analysis on data.You survey several students on campus and ask them a few questions.Which format below would you use to enter the data into a software program?
(Multiple Choice)
4.8/5 (35)
In this experiment,the risk-taking propensity of 90 inner city drug users was measured using a repeated measures test called the Behavioral Analogue Risk Task (BART;Lejuez et al. ,2002).The higher the BART score,the higher the risk-taking propensity.Participants also filled out questionnaires so that their Psychopathic Personality Inventory (PPI)scores could be computed.PPI scores are used to detect psychopathic traits in a covert manner and are a common indicator of one's level of psychopathy.The main goal of the experiment was to examine the relationship between risk-taking (measured by BART)based on one's level of psychopathy (measured by PPI on a scale of 0-100),gender (1 for male and 2 for female),and heroin use (1 for heroin use and 0 for no heroin use).Below is a partial output of a multiple regression analysis.  Based on this model,are heroin users bigger risktakers than non-heroin users?
(Multiple Choice)
4.9/5 (37)
In this experiment,the risk-taking propensity of 90 inner city drug users was measured using a repeated measures test called the Behavioral Analogue Risk Task (BART;Lejuez et al. ,2002).The higher the BART score,the higher the risk-taking propensity.Participants also filled out questionnaires so that their Psychopathic Personality Inventory (PPI)scores could be computed.PPI scores are used to detect psychopathic traits in a covert manner and are a common indicator of one's level of psychopathy.The main goal of the experiment was to examine the relationship between risk-taking (measured by BART)based on one's level of psychopathy (measured by PPI on a scale of 0-100),gender (1 for male and 2 for female),and heroin use (1 for heroin use and 0 for no heroin use).Below is a partial output of a multiple regression analysis.  Based on this model,are men bigger risktakers than women?
(Multiple Choice)
4.8/5 (44)
A researcher is investigating possible explanations for deaths in traffic accidents.He examined data from 1991 for each of the 50 states plus Washington,DC.The data included information on the following variables. 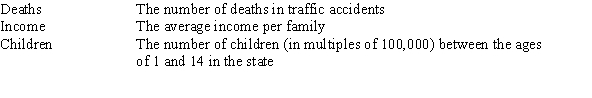 As part of his investigation he ran the multiple regression model, Deaths = 0 + 1(Children)+ 2(Income)+ i,
Where the deviations i were assumed to be independent and Normally distributed with a mean of 0 and a standard deviation of .This model was fit to the data using the method of least squares.The following results were obtained from statistical software.
As part of his investigation he ran the multiple regression model, Deaths = 0 + 1(Children)+ 2(Income)+ i,
Where the deviations i were assumed to be independent and Normally distributed with a mean of 0 and a standard deviation of .This model was fit to the data using the method of least squares.The following results were obtained from statistical software. 
 The researcher also ran the simple linear regression model
Deaths = 0 + 2(Income)+ i.
The following results were obtained from statistical software:
The researcher also ran the simple linear regression model
Deaths = 0 + 2(Income)+ i.
The following results were obtained from statistical software: 
 Based on the above results,the researcher tested the hypotheses H0: 2 = 0 versus Ha: 2 0.What do we know about the P-value of the test?
(Multiple Choice)
4.9/5 (36)
The data referred to in this question were collected from several sales districts across the country.The data represent sales for a maker of asphalt roofing shingles.Information on the following variables is available.  Partial SPSS regression output of a multiple regression model with sales as the response variable and the other four variables as predictor variables are given below.
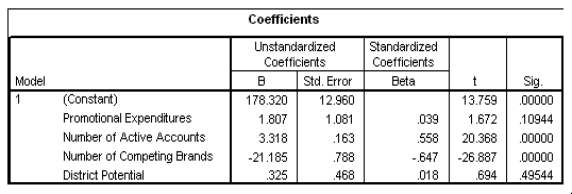 How many districts were sampled in all?
(Multiple Choice)
4.8/5 (36)
The data referred to in this question were collected from several sales districts across the country.The data represent sales for a maker of asphalt roofing shingles.Information on the following variables is available. 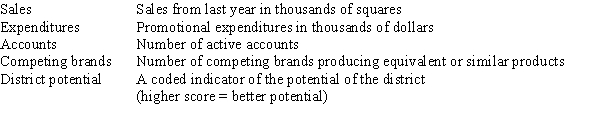 Partial SPSS regression output of a multiple regression model with sales as the response variable and the other four variables as predictor variables are given below.
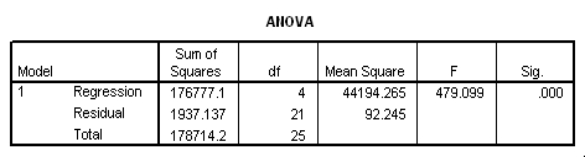
 What proportion of the variation in sales is explained by the set of all four explanatory variables?
(Multiple Choice)
4.9/5 (41)
Campus crime rates are generally lower than the national average;however thousands of crimes take place on college campuses daily.Cities that are notoriously dangerous would likely be undesirable locations for a college campus.A study examined the crime rates on campuses throughout the United States and whether or not they were significantly affected by surrounding cities.A regression analysis was performed to investigate which characteristics of a city,along with a few chosen demographics of a school,impacted the crime rate on a college campus.There are over 4000 colleges and universities in the United States.The study included a random sample of 129 institutions.The response variable was the number of crimes per 1000 people.Explanatory variables included the percent of married couples in the city (married),tuition of the university (tuition),average income of the city (income),unemployment rate of the city (unemployment),percent of students who belong to a fraternity or sorority (Greek),average age of the students at the university (age),and number of liquor stores in the city (liquor).A complete analysis of the data is shown below. 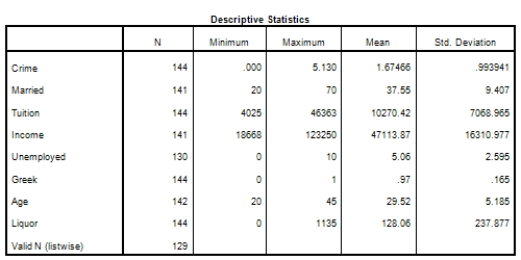
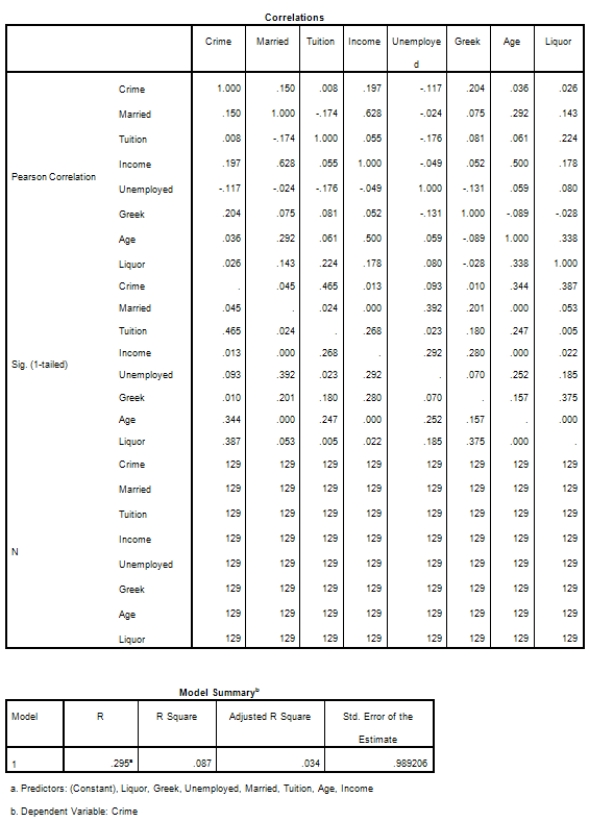
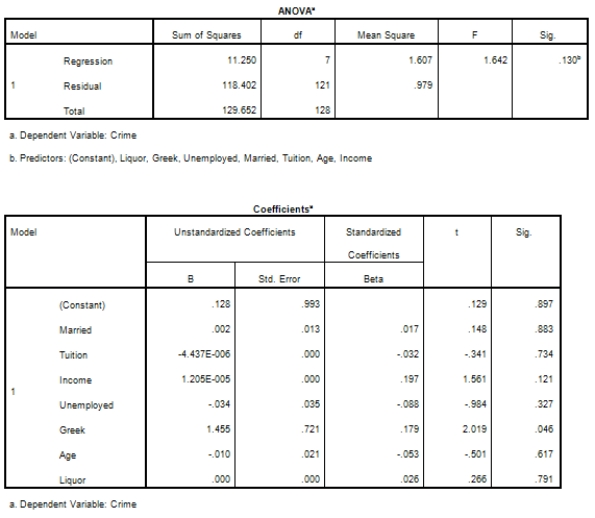
 Does the significance test for the individual regression coefficients for marriage and income contradict the information we obtained from the correlation table?
(Multiple Choice)
4.8/5 (46)
Based on a sample of the salaries of professors at a major university,you have performed a multiple linear regression relating salary to years of service and gender.The data included information on the following variables.  The estimated multiple linear regression model is Salary = 45 + 3(Years)+ 4(Gender)+ 1(Years)(Gender).
Using the multiple linear regression equation,what would you estimate the average salary of male professors with 3 years of experience to be?
The estimated multiple linear regression model is Salary = 45 + 3(Years)+ 4(Gender)+ 1(Years)(Gender).
Using the multiple linear regression equation,what would you estimate the average salary of male professors with 3 years of experience to be?
(Multiple Choice)
4.9/5 (36)
In order to perform a multiple regression analysis,which variables are assumed to be normally distributed?
(Multiple Choice)
4.8/5 (30)
Researchers at a car resale company are trying to build a model to predict a car's 4-year resale value (in thousands of dollars)from several predictor variables.The variables they selected are as below.  Data were collected on cars of different models made by different manufacturers.SPSS output for the least-squares regression model is given below.
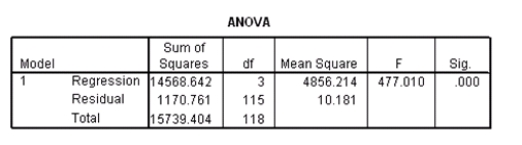
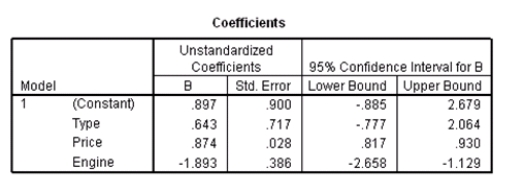 A particular car (not a truck)cost $40,000 and has an engine of 3.8 liters.What do you predict the 4-year resale value of this car to be?
(Short Answer)
4.8/5 (34)
A mortality benefit for breast cancer from mammography screening has been recognized since randomized clinical trial data were first published in 1977.Mammography detects breast cancer at early stages of the disease when treatment is still effective.A logistic regression model was used to determine whether or not women had a mammogram within the past 2 years in California.A study asked 3000 women between the ages of 40 and 85 if they had a mammogram within the last 2 years.A partial result of the multiple logistic regression model is shown below. 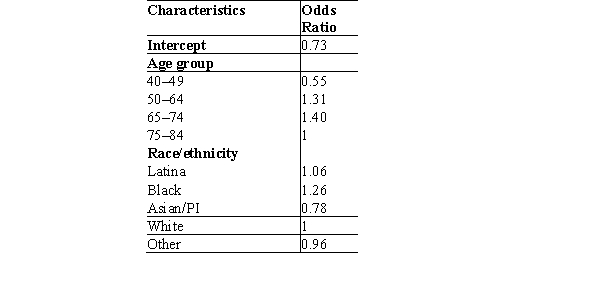 What age group has the lowest probability of having a mammogram?
(Multiple Choice)
4.9/5 (35)
Researchers at a car resale company are trying to build a model to predict a car's 4-year resale value (in thousands of dollars)from several predictor variables.The variables they selected are as below.  Data were collected on cars of different models made by different manufacturers.SPSS output for the least-squares regression model is given below.

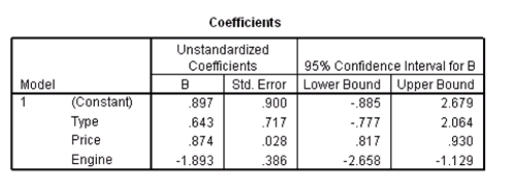 What is the value of an estimate for the error standard deviation ?
(Short Answer)
4.9/5 (33)
Based on a sample of the salaries of professors at a major university,you have performed a multiple linear regression relating salary to years of service and gender.The data included information on the following variables.  The estimated multiple linear regression model is Salary = 45 + 3(Years)+ 4(Gender)+ 1(Years)(Gender).
Using the multiple linear regression equation,what would you estimate the average difference in the salaries of a male professor with 3 years of service and a female professor with 3 years of service to be?
The estimated multiple linear regression model is Salary = 45 + 3(Years)+ 4(Gender)+ 1(Years)(Gender).
Using the multiple linear regression equation,what would you estimate the average difference in the salaries of a male professor with 3 years of service and a female professor with 3 years of service to be?
(Multiple Choice)
4.7/5 (29)
A mortality benefit for breast cancer from mammography screening has been recognized since randomized clinical trial data were first published in 1977.Mammography detects breast cancer at early stages of the disease when treatment is still effective.A logistic regression model was used to determine whether or not women had a mammogram within the past 2 years in California.A study asked 3000 women between the ages of 40 and 85 if they had a mammogram within the last 2 years.A partial result of the multiple logistic regression model is shown below. 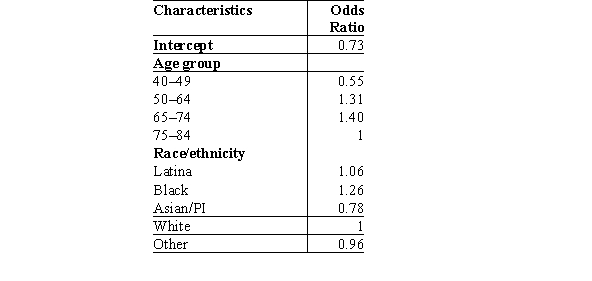 What race/ethnicity group has the highest probability of having a mammogram?
(Multiple Choice)
4.8/5 (27)
What is the major difference between a simple linear regression model and a multiple linear regression model?
(Multiple Choice)
4.7/5 (36)
Refining the model in multiple regression in order to build the best model is called ______.
(Multiple Choice)
4.8/5 (35)
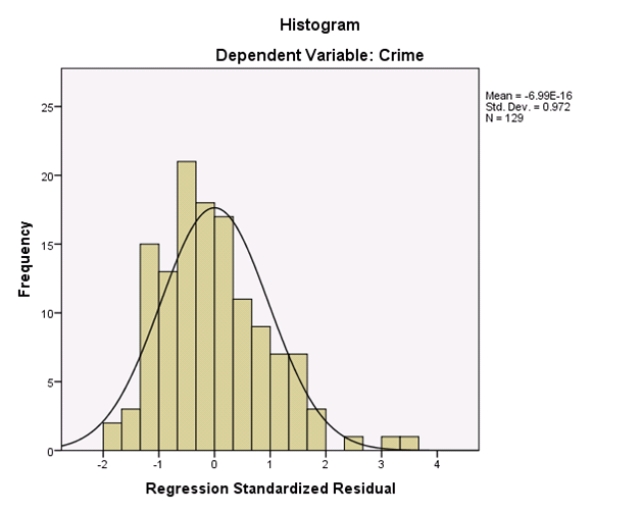
Campus crime rates are generally lower than the national average;however thousands of crimes take place on college campuses daily.Cities that are notoriously dangerous would likely be undesirable locations for a college campus.A study examined the crime rates on campuses throughout the United States and whether or not they were significantly affected by surrounding cities.A regression analysis was performed to investigate which characteristics of a city,along with a few chosen demographics of a school,impacted the crime rate on a college campus.There are over 4000 colleges and universities in the United States.The study included a random sample of 129 institutions.The response variable was the number of crimes per 1000 people.Explanatory variables included the percent of married couples in the city (married),tuition of the university (tuition),average income of the city (income),unemployment rate of the city (unemployment),percent of students who belong to a fraternity or sorority (Greek),average age of the students at the university (age),and number of liquor stores in the city (liquor).A complete analysis of the data is shown below. 


 Does the response variable,crime,meet the assumption necessary for the analysis?
(Multiple Choice)
5.0/5 (27)
Filters
- Essay(0)
- Multiple Choice(0)
- Short Answer(0)
- True False(0)
- Matching(0)