Exam 11: Multiple Regression
Exam 1: Looking at Datadistributions127 Questions
Exam 2: Looking at Datarelationships48 Questions
Exam 3: Producing Data70 Questions
Exam 4: Probability: the Study of Randomness93 Questions
Exam 5: Sampling Distributions77 Questions
Exam 6: Introduction to Inference89 Questions
Exam 7: Inference for Means103 Questions
Exam 8: Inference for Proportions101 Questions
Exam 9: Inference for Categorical Data122 Questions
Exam 10: Inference for Regression91 Questions
Exam 11: Multiple Regression95 Questions
Exam 12: One-Way Analysis of Variance74 Questions
Exam 13: Two-Way Analysis of Variance53 Questions
Exam 14: Logistic Regression53 Questions
Exam 15: Nonparametric Tests57 Questions
Exam 16: Bootstrap Methods and Permutation Tests42 Questions
Exam 17: Statistics for Quality: Control and Capability86 Questions
Select questions type
A researcher is investigating variables that might be associated with the academic performance of high school students.She examined data from 1990 for each of the 50 states plus Washington,DC.The data included information on the following variables. 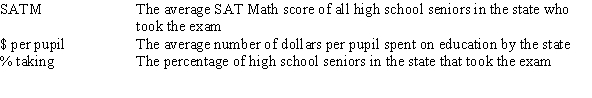 As part of her investigation,she ran the multiple regression model SATM = 0 + 1($ per pupil)+ 2(% taking)+ i,
Where the deviations i were assumed to be independent and Normally distributed with a mean of 0 and a standard deviation of .This model was fit to the data using the method of least squares.The following results were obtained from statistical software.
As part of her investigation,she ran the multiple regression model SATM = 0 + 1($ per pupil)+ 2(% taking)+ i,
Where the deviations i were assumed to be independent and Normally distributed with a mean of 0 and a standard deviation of .This model was fit to the data using the method of least squares.The following results were obtained from statistical software. 
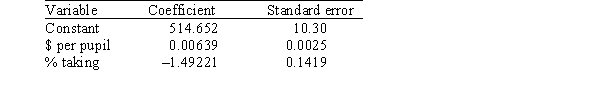
 Another researcher,using the same data,ran the simple linear regression model
SATM = 0 + 1($ per pupil)+ i.
The following results were obtained from statistical software.
Another researcher,using the same data,ran the simple linear regression model
SATM = 0 + 1($ per pupil)+ i.
The following results were obtained from statistical software. 
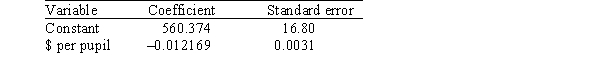 Based on these results,a 95% confidence interval for 1,the coefficient of the variable $ per pupil,is approximately
(Multiple Choice)
4.7/5  (34)
(34)
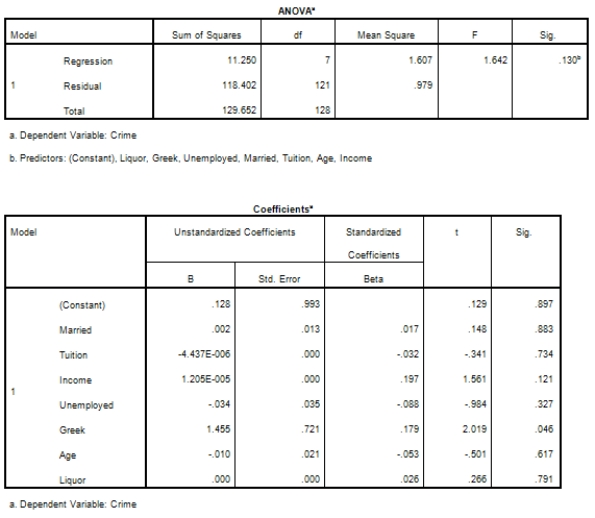
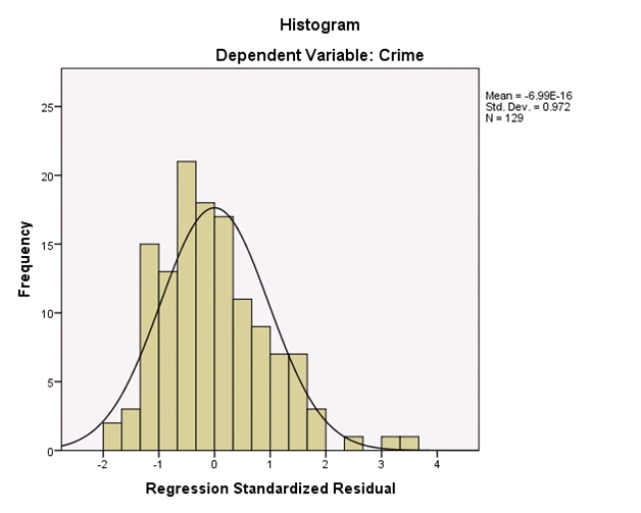
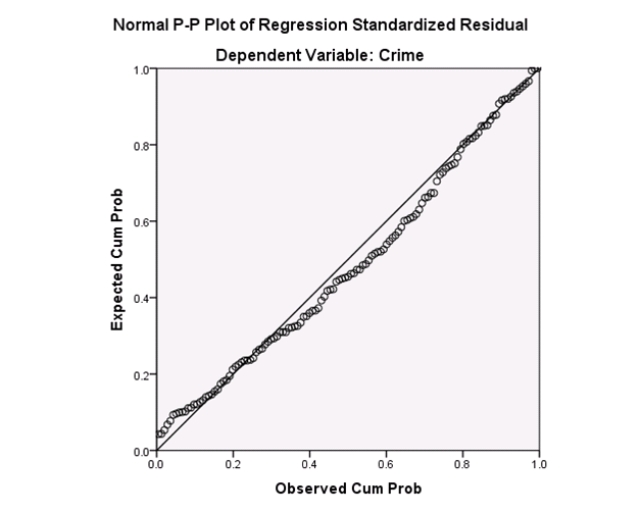
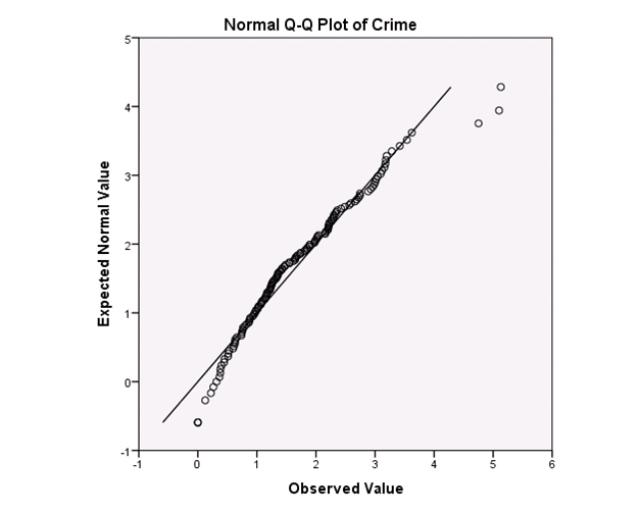
Campus crime rates are generally lower than the national average;however thousands of crimes take place on college campuses daily.Cities that are notoriously dangerous would likely be undesirable locations for a college campus.A study examined the crime rates on campuses throughout the United States and whether or not they were significantly affected by surrounding cities.A regression analysis was performed to investigate which characteristics of a city,along with a few chosen demographics of a school,impacted the crime rate on a college campus.There are over 4000 colleges and universities in the United States.The study included a random sample of 129 institutions.The response variable was the number of crimes per 1000 people.Explanatory variables included the percent of married couples in the city (married),tuition of the university (tuition),average income of the city (income),unemployment rate of the city (unemployment),percent of students who belong to a fraternity or sorority (Greek),average age of the students at the university (age),and number of liquor stores in the city (liquor).A complete analysis of the data is shown below. 

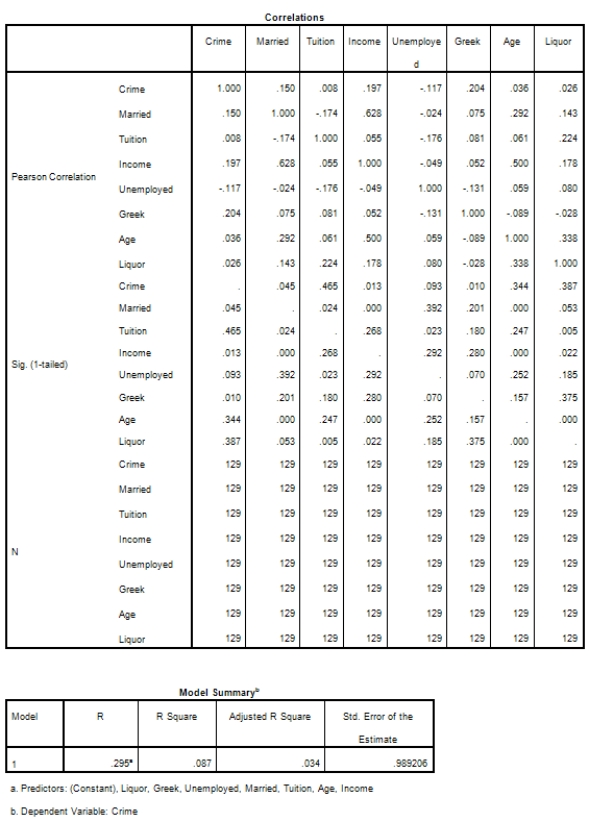
 The explanatory variables tuition,age,and liquor not highly corrected with crime.Does that mean they should not be in the model?
(Multiple Choice)
4.9/5 (38)
A researcher is investigating possible explanations for deaths in traffic accidents.He examined data from 1991 for each of the 50 states plus Washington,DC.The data included information on the following variables.  As part of his investigation he ran the multiple regression model, Deaths = 0 + 1(Children)+ 2(Income)+ i,
Where the deviations i were assumed to be independent and Normally distributed with a mean of 0 and a standard deviation of .This model was fit to the data using the method of least squares.The following results were obtained from statistical software.
As part of his investigation he ran the multiple regression model, Deaths = 0 + 1(Children)+ 2(Income)+ i,
Where the deviations i were assumed to be independent and Normally distributed with a mean of 0 and a standard deviation of .This model was fit to the data using the method of least squares.The following results were obtained from statistical software. 
 What is a 99% confidence interval for 2,the coefficient of the variable income?
(Multiple Choice)
4.9/5 (40)
Many people believe that parents' marital status influences their child's development throughout life and has a large effect on their child's skill in sports.A survey was sent to 100 students who were in athletics in college.Responses from 35 students were received.The researchers were interested in determining whether the marital status and level of happiness of the students' parents would predict the student's self-rated skill level in a sport.What is/are the explanatory variables in this study?
(Multiple Choice)
4.9/5 (39)
Malaria is a leading cause of infectious disease and death worldwide.It is also a popular example of a vector-borne disease that could be greatly affected by the influence of climate change.A study was done to determine the relationship between reported malaria cases in West Africa and several weather variables (for example,mean temperature (°C),dew point (°C),maximum temperature (°C),minimum temperature (°C),and total precipitation (mm)).The data were collected over a 10-year period.Below are the results of a correlation analysis with all considered variables.The Pearson correlation coefficients are displayed as the top value.The P-value for the test of the null hypothesis that the population correlation is zero versus the two-sided alternative is the bottom value.  Which pair of variables has the strongest correlation?
(Multiple Choice)
4.8/5 (30)
In this experiment,the risk-taking propensity of 90 inner city drug users was measured using a repeated measures test called the Behavioral Analogue Risk Task (BART;Lejuez et al. ,2002).The higher the BART score,the higher the risk-taking propensity.Participants also filled out questionnaires so that their Psychopathic Personality Inventory (PPI)scores could be computed.PPI scores are used to detect psychopathic traits in a covert manner and are a common indicator of one's level of psychopathy.The main goal of the experiment was to examine the relationship between risk-taking (measured by BART)based on one's level of psychopathy (measured by PPI on a scale of 0-100),gender (1 for male and 2 for female),and heroin use (1 for heroin use and 0 for no heroin use).Below is a partial output of a multiple regression analysis.  How many explanatory variables are in this study?
(Multiple Choice)
4.7/5 (38)
A study was conducted on 40 different brands of golf balls with respect to the distance the ball traveled after being struck with standardized test 7-iron.The response variable DIST is the measurement of the carry distance of the shot in yards.The explanatory variables are SMASH,the ratio of the ball speed/club speed at impact;SPIN,the initial spin rate of the ball in RPMs;and HEIGHT,the peak height of the ball in flight measured in feet. The following is a table showing some computer output (missing results are shown by **)for a least-squares fit of a multiple regression model using these variables. 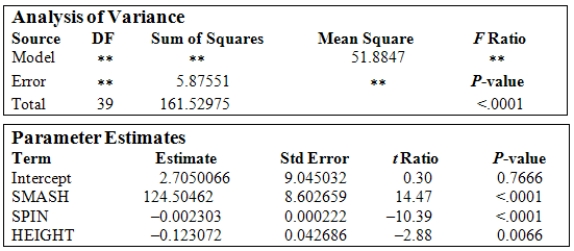 Based upon the P-value of the ANOVA F test,what can be concluded about the relationship between the response variable and the explanatory variables?
(Multiple Choice)
4.8/5 (39)
Malaria is a leading cause of infectious disease and death worldwide.It is also a popular example of a vector-borne disease that could be greatly affected by the influence of climate change.A study was done to determine the relationship between reported malaria cases in West Africa and several weather variables (for example,mean temperature (°C),dew point (°C),maximum temperature (°C),minimum temperature (°C),and total precipitation (mm)).The data were collected over a 10-year period.Below are the results of a correlation analysis with all considered variables.The Pearson correlation coefficients are displayed as the top value.The P-value for the test of the null hypothesis that the population correlation is zero versus the two-sided alternative is the bottom value. 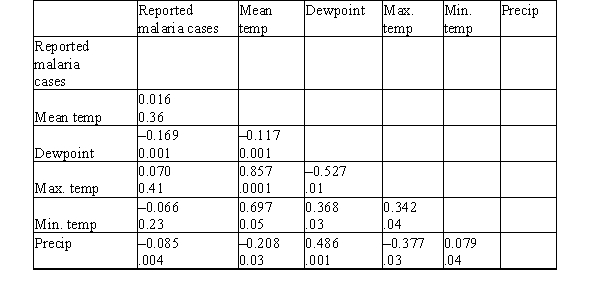 Which variable has the strongest correlation with the reported malaria cases?
(Multiple Choice)
4.8/5 (33)
Researchers at a large nutrition and weight management company are trying to build a model to predict a person's body fat percentage from an array of variables such as body weight,height,and body measurements around the neck,chest,abdomen,hips,biceps,etc.A variable selection method is used to build a simple model.SPSS output for the final model is given below. 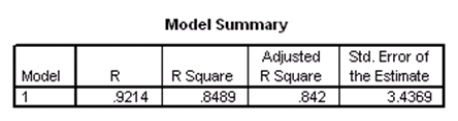
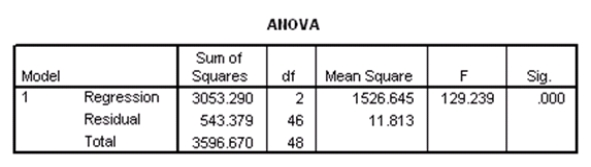
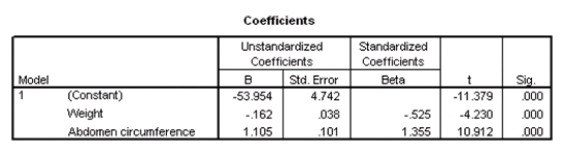 What percentage of the variation in percent body fat remains unexplained,even after introducing weight and abdomen circumference into the model?
(Multiple Choice)
4.9/5 (34)
A researcher is investigating variables that might be associated with the academic performance of high school students.She examined data from 1990 for each of the 50 states plus Washington,DC.The data included information on the following variables.  As part of her investigation,she ran the multiple regression model SATM = 0 + 1($ per pupil)+ 2(% taking)+ i,
Where the deviations i were assumed to be independent and Normally distributed with a mean of 0 and a standard deviation of .This model was fit to the data using the method of least squares.The following results were obtained from statistical software.
As part of her investigation,she ran the multiple regression model SATM = 0 + 1($ per pupil)+ 2(% taking)+ i,
Where the deviations i were assumed to be independent and Normally distributed with a mean of 0 and a standard deviation of .This model was fit to the data using the method of least squares.The following results were obtained from statistical software. 
 Another researcher,using the same data,ran the simple linear regression model
SATM = 0 + 1($ per pupil)+ i.
The following results were obtained from statistical software.
Another researcher,using the same data,ran the simple linear regression model
SATM = 0 + 1($ per pupil)+ i.
The following results were obtained from statistical software. 
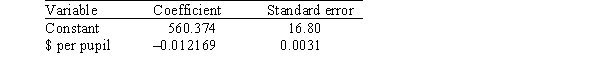 The first researcher concluded that because the coefficient for the variable $ per pupil was positive in her results,spending additional money on students would have a positive effect on SATM scores.This researcher therefore recommended more money be spent on students.The second researcher concluded that because the coefficient for the variable $ per pupil was negative in his results,spending additional money on students would have a negative effect on SATM scores.This researcher therefore recommended less money be spent on students.Why are these two conclusions different even though the researchers used the same data?
(Multiple Choice)
5.0/5 (31)
A multiple linear regression model can be described by DATA = FIT + RESIDUAL.What does the FIT part represent?
(Multiple Choice)
4.8/5 (39)
A researcher is investigating possible explanations for deaths in traffic accidents.He examined data from 1991 for each of the 50 states plus Washington,DC.The data included information on the following variables. 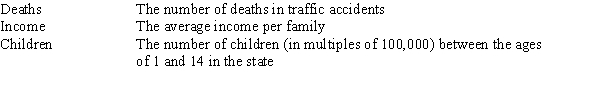 As part of his investigation he ran the multiple regression model, Deaths = 0 + 1(Children)+ 2(Income)+ i,
Where the deviations i were assumed to be independent and Normally distributed with a mean of 0 and a standard deviation of .This model was fit to the data using the method of least squares.The following results were obtained from statistical software.
As part of his investigation he ran the multiple regression model, Deaths = 0 + 1(Children)+ 2(Income)+ i,
Where the deviations i were assumed to be independent and Normally distributed with a mean of 0 and a standard deviation of .This model was fit to the data using the method of least squares.The following results were obtained from statistical software. 
 The researcher also ran the simple linear regression model
Deaths = 0 + 2(Income)+ i.
The following results were obtained from statistical software:
The researcher also ran the simple linear regression model
Deaths = 0 + 2(Income)+ i.
The following results were obtained from statistical software: 
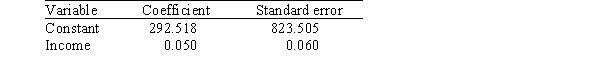 What can we conclude regarding the meaningfulness of the analyses?
(Multiple Choice)
4.8/5 (35)
In this experiment,the risk-taking propensity of 90 inner city drug users was measured using a repeated measures test called the Behavioral Analogue Risk Task (BART;Lejuez et al. ,2002).The higher the BART score,the higher the risk-taking propensity.Participants also filled out questionnaires so that their Psychopathic Personality Inventory (PPI)scores could be computed.PPI scores are used to detect psychopathic traits in a covert manner and are a common indicator of one's level of psychopathy.The main goal of the experiment was to examine the relationship between risk-taking (measured by BART)based on one's level of psychopathy (measured by PPI on a scale of 0-100),gender (1 for male and 2 for female),and heroin use (1 for heroin use and 0 for no heroin use).Below is a partial output of a multiple regression analysis.  What is the response variable in this study?
(Multiple Choice)
4.8/5 (29)
A researcher is investigating variables that might be associated with the academic performance of high school students.She examined data from 1990 for each of the 50 states plus Washington,DC.The data included information on the following variables.  As part of her investigation,she ran the multiple regression model SATM = 0 + 1($ per pupil)+ 2(% taking)+ i,
Where the deviations i were assumed to be independent and Normally distributed with a mean of 0 and a standard deviation of .This model was fit to the data using the method of least squares.The following results were obtained from statistical software.
As part of her investigation,she ran the multiple regression model SATM = 0 + 1($ per pupil)+ 2(% taking)+ i,
Where the deviations i were assumed to be independent and Normally distributed with a mean of 0 and a standard deviation of .This model was fit to the data using the method of least squares.The following results were obtained from statistical software. 
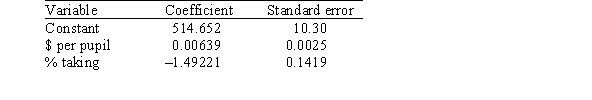 What is the value of the MSE?
(Multiple Choice)
4.9/5 (38)
Campus crime rates are generally lower than the national average;however thousands of crimes take place on college campuses daily.Cities that are notoriously dangerous would likely be undesirable locations for a college campus.A study examined the crime rates on campuses throughout the United States and whether or not they were significantly affected by surrounding cities.A regression analysis was performed to investigate which characteristics of a city,along with a few chosen demographics of a school,impacted the crime rate on a college campus.There are over 4000 colleges and universities in the United States.The study included a random sample of 129 institutions.The response variable was the number of crimes per 1000 people.Explanatory variables included the percent of married couples in the city (married),tuition of the university (tuition),average income of the city (income),unemployment rate of the city (unemployment),percent of students who belong to a fraternity or sorority (Greek),average age of the students at the university (age),and number of liquor stores in the city (liquor).A complete analysis of the data is shown below. 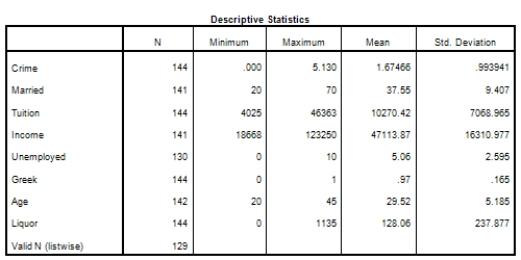


 What type of statistical analysis was used on these data?
(Multiple Choice)
4.9/5 (34)
Filters
- Essay(0)
- Multiple Choice(0)
- Short Answer(0)
- True False(0)
- Matching(0)