Exam 9: An Introduction to the Short Run
Exam 1: Introduction to Macroeconomics35 Questions
Exam 2: Measuring the Macroeconomy114 Questions
Exam 3: An Overview of Long-Run Economic Growth110 Questions
Exam 4: A Model of Production129 Questions
Exam 5: The Solow Growth Model126 Questions
Exam 6: Growth and Ideas120 Questions
Exam 7: The Labor Market, Wages, and Unemployment119 Questions
Exam 8: Inflation117 Questions
Exam 9: An Introduction to the Short Run113 Questions
Exam 10: The Great Recession: a First Look108 Questions
Exam 11: The Is Curve128 Questions
Exam 12: Monetary Policy and the Phillips Curve135 Questions
Exam 13: Stabilization Policy and the Asad Framework113 Questions
Exam 14: The Great Recession and the Short-Run Model112 Questions
Exam 15: Dsge Models: the Frontier of Business Cycle Research119 Questions
Exam 16: Consumption109 Questions
Exam 17: Investment116 Questions
Exam 18: The Government and the Macroeconomy122 Questions
Exam 19: International Trade107 Questions
Exam 20: Exchange Rates and International Finance142 Questions
Exam 21: Parting Thoughts35 Questions
Select questions type
Defining  as current output,
  as potential output, and
  as short-run fluctuations, the equation
 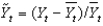 is defined as the percentage deviation of current output from potential output.
(True/False)
4.8/5  (32)
(32)
Okun's law shows the ________ relationship between ________ and ________.
(Multiple Choice)
4.9/5 (35)
Refer to the following figure when answering the following questions.
Figure 9.4: Phillips Curve 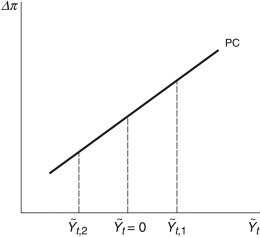 -Consider the Phillips curve at
  in Figure 9.4. Which of the following is true?
(Multiple Choice)
4.8/5 (30)
Suppose an economy's natural rate of unemployment is 5 percent. If the unemployment rate is 3 percent, according to Okun's law,  is ________ percent.
(Multiple Choice)
4.8/5 (32)
You are a staff economist with the Federal Reserve. The chairman says to you, "The rate of change in inflation is too high, and I think the Phillips curve is horizontal. What should we do to reduce these inflationary increases?" How do you respond?
(Multiple Choice)
4.9/5 (40)
Taken together, the Phillips curve and Okun's law imply there is a short-term ________ relationship between ________ and inflation.
(Multiple Choice)
4.8/5 (28)
Suppose an economy exhibits a large unexpected increase in productivity growth that lasts for a decade; however, monetary policymakers are slow to recognize that the change is to potential-not current-output, and they interpret the increase in output as a boom that leads current to exceed potential output. In this scenario, policymakers believe that ________ pressures are building and incorrectly respond by ________ interest rates, sending the economy into a(n) ________ gap.
(Multiple Choice)
4.9/5 (34)
Which of the following is NOT an example of a short-term macroeconomic shock?
(Multiple Choice)
4.8/5 (32)
According to the text, which of the following can be used to estimate potential output?
i. Get the data from the Census Bureau.
ii. Survey leading economists.
iii. Gather current data from statistical agencies, such as the Bureau of Economic Analysis.
(Multiple Choice)
4.9/5 (34)
According to the Phillips curve presented in the text, a positive macroeconomic shock:
(Multiple Choice)
4.9/5 (34)
When the U.S. economy bottomed out during the Great Depression, the unemployment rate hit about ________ percent in ________.
(Multiple Choice)
4.8/5 (34)
An increase in planned investment expenditures is a short-term economic shock.
(True/False)
4.7/5 (38)
If current output is  billion and potential output
  Billion, then the economy is in a ________ and
  Is about ________ percent.
(Multiple Choice)
4.9/5 (31)
Consider the following three figures, which show the Phillips curve relationship for the 1970s, 1980s, and 1990s. The output gap is on the x-axis and the change in inflation, , is on the y-axis. Explain what each of these Phillips curves tells us about each of the three decades. In which period would fighting inflation be the most difficult?Figure 9.9: Phillips Curve Relationship, 1970s 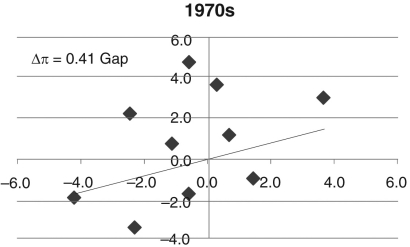 Figure 9.10: Phillips Curve Relationship, 1980s
 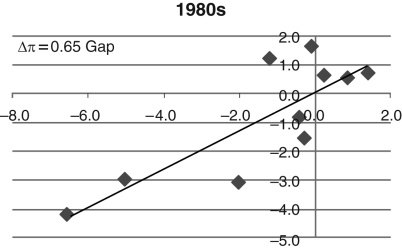 Figure 9.11: Phillips Curve Relationship, 1990s
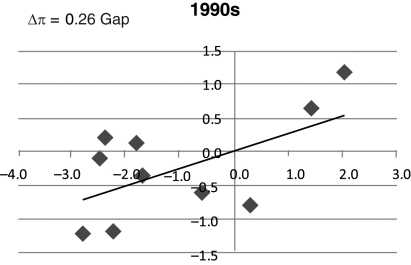
(Essay)
4.8/5 (30)
Taxes, oil price changes, government spending, interest rate changes, new technologies, and disasters are examples of:
(Multiple Choice)
4.8/5 (33)
Filters
- Essay(0)
- Multiple Choice(0)
- Short Answer(0)
- True False(0)
- Matching(0)