Exam 9: An Introduction to the Short Run
Exam 1: Introduction to Macroeconomics35 Questions
Exam 2: Measuring the Macroeconomy114 Questions
Exam 3: An Overview of Long-Run Economic Growth110 Questions
Exam 4: A Model of Production129 Questions
Exam 5: The Solow Growth Model126 Questions
Exam 6: Growth and Ideas120 Questions
Exam 7: The Labor Market, Wages, and Unemployment119 Questions
Exam 8: Inflation117 Questions
Exam 9: An Introduction to the Short Run113 Questions
Exam 10: The Great Recession: a First Look108 Questions
Exam 11: The Is Curve128 Questions
Exam 12: Monetary Policy and the Phillips Curve135 Questions
Exam 13: Stabilization Policy and the Asad Framework113 Questions
Exam 14: The Great Recession and the Short-Run Model112 Questions
Exam 15: Dsge Models: the Frontier of Business Cycle Research119 Questions
Exam 16: Consumption109 Questions
Exam 17: Investment116 Questions
Exam 18: The Government and the Macroeconomy122 Questions
Exam 19: International Trade107 Questions
Exam 20: Exchange Rates and International Finance142 Questions
Exam 21: Parting Thoughts35 Questions
Select questions type
Refer to the following figure when answering the following questions.
Figure 9.5: U.S. Inflation 1960-2015 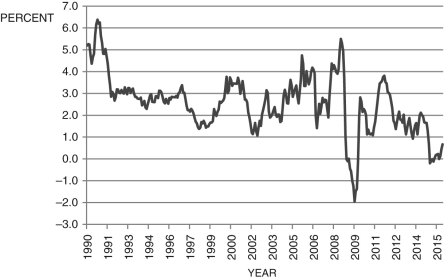 (Source: Bureau of Labor Statistics)
-Consider Figure 9.5, which shows the annual inflation rate. According to the Phillips curve, the period from about 2003 to 2005 was a period of:
(Source: Bureau of Labor Statistics)
-Consider Figure 9.5, which shows the annual inflation rate. According to the Phillips curve, the period from about 2003 to 2005 was a period of:
(Multiple Choice)
4.7/5  (27)
(27)
Defining u as the unemployment rate and  as the natural rate of unemployment, Okun's law is given by the following equation:
(Multiple Choice)
4.9/5 (33)
According to the text, the slope of the Phillips curve in the United States is about ________. Thus, if the gap is 6 percent, the change in inflation would be ________ percent.
(Multiple Choice)
4.7/5 (37)
The Phillips curve in the text shows the ________ relationship between ________ and ________.
(Multiple Choice)
4.8/5 (40)
The Phillips curve shows the negative relationship between output fluctuations and the change in inflation.
(True/False)
4.8/5 (28)
Which of the following is NOT an example of a short-term macroeconomic shock?
(Multiple Choice)
4.8/5 (37)
Defining  as current output,
  As potential output, and
  As short-run output, which of the following equations defines short-run output as the short-run fluctuation's share of potential GDP?
(Multiple Choice)
4.8/5 (41)
Suppose an economy exhibits a large unexpected decrease in productivity growth that lasts for a decade; however, monetary policymakers are slow to recognize that the change is to potential-not current-output, and they interpret the decrease in output as a recession that leads current to fall below potential output. In this scenario, policymakers believe that ________ pressures are building and incorrectly respond by ________ interest rates, sending the economy into a(n) ________ gap.
(Multiple Choice)
5.0/5 (28)
Refer to the following figure when answering the following questions.
Figure 9.4: Phillips Curve 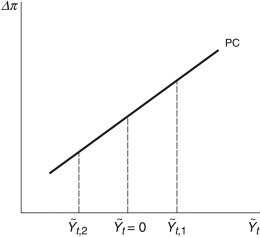 -Consider the Phillips curve at
  in Figure 9.4. The economy is:
(Multiple Choice)
4.8/5 (34)
Refer to the following figure when answering the following questions.
Figure 9.2: U.S. Output Fluctuations 1960-2015 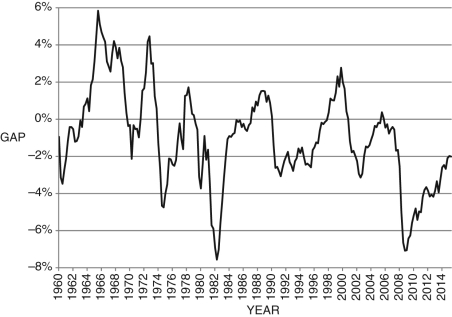 -Consider Figure 9.2. The line represents short-run fluctuations,
  . Since 1960, the largest economic "boom" was in about ________ and the deepest recession was in about ________.
(Multiple Choice)
4.7/5 (35)
According to the text, which of the following can be used to approximate potential output?
i. Assume a perfectly smooth trend is passing through the quarter-to-quarter movements in the real GDP.
ii. Survey leading economists.
iii. Gather current data from statistical agencies, such as the Bureau of Economic Analysis.
(Multiple Choice)
4.8/5 (21)
If current output is  billion and potential output
  Billion, then the economy is in a ________ and
  Is about ________ percent.
(Multiple Choice)
4.7/5 (35)
Refer to the following figure when answering the following questions.
Figure 9.2: U.S. Output Fluctuations 1960-2015
-Consider Figure 9.2. In approximately what years did the U.S. economy experience its longest economic downturn, using the text's definition of a recessionary gap?
(Multiple Choice)
4.9/5 (28)
Which of the following is NOT an example of a short-term macroeconomic shock?
(Multiple Choice)
4.9/5 (37)
Figure 9.6: Economic Boom versus Recession 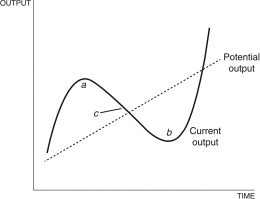 -In Figure 9.6 above, area b represents an economic boom, and area a is a recession.
(True/False)
4.9/5 (39)
Defining u as the unemployment rate and  as the natural rate of unemployment, Okun's law is given by
  .
.
(True/False)
4.9/5 (35)
Defining u as the unemployment rate and  as the natural rate of unemployment, we can write Okun's law as the following equation:
(Multiple Choice)
4.9/5 (38)
Filters
- Essay(0)
- Multiple Choice(0)
- Short Answer(0)
- True False(0)
- Matching(0)