Exam 9: An Introduction to the Short Run
Exam 1: Introduction to Macroeconomics35 Questions
Exam 2: Measuring the Macroeconomy114 Questions
Exam 3: An Overview of Long-Run Economic Growth110 Questions
Exam 4: A Model of Production129 Questions
Exam 5: The Solow Growth Model126 Questions
Exam 6: Growth and Ideas120 Questions
Exam 7: The Labor Market, Wages, and Unemployment119 Questions
Exam 8: Inflation117 Questions
Exam 9: An Introduction to the Short Run113 Questions
Exam 10: The Great Recession: a First Look108 Questions
Exam 11: The Is Curve128 Questions
Exam 12: Monetary Policy and the Phillips Curve135 Questions
Exam 13: Stabilization Policy and the Asad Framework113 Questions
Exam 14: The Great Recession and the Short-Run Model112 Questions
Exam 15: Dsge Models: the Frontier of Business Cycle Research119 Questions
Exam 16: Consumption109 Questions
Exam 17: Investment116 Questions
Exam 18: The Government and the Macroeconomy122 Questions
Exam 19: International Trade107 Questions
Exam 20: Exchange Rates and International Finance142 Questions
Exam 21: Parting Thoughts35 Questions
Select questions type
Generally speaking, the rate of inflation ________ during a recession.
(Multiple Choice)
4.8/5  (34)
(34)
Refer to the following figure when answering the following questions.
Figure 9.1: Output versus Time
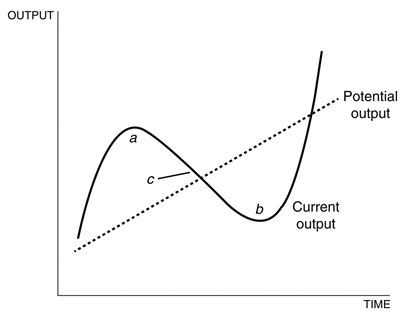 -Considering Figure 9.1:
(Multiple Choice)
4.9/5 (43)
Refer to the following figure to answer the following questions.
Figure 9.3: Percent Change in U.S. Employment: 1980-2015 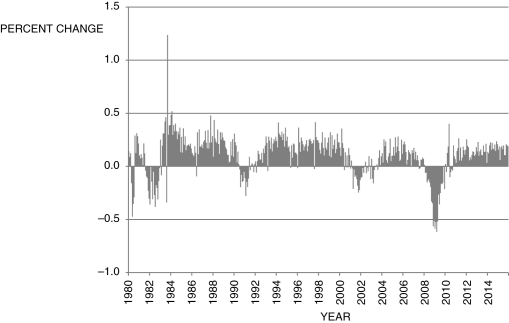 -Based on the data presented in Figure 9.3, which of the following periods is/are likely (an) expansion(s)?
(Multiple Choice)
4.8/5 (27)
If  , the macroeconomy is producing at its potential level of output.
(True/False)
4.8/5 (42)
According to Okun's law, if the Federal Reserve wants to reduce unemployment, it should ________ interest rates, which would ________ output.
(Multiple Choice)
4.7/5 (37)
Refer to the following figure when answering the following questions.
Figure 9.2: U.S. Output Fluctuations 1960-2015 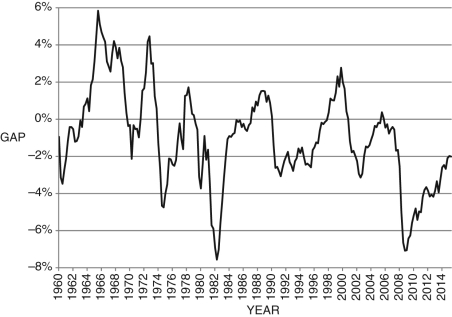 -Consider Figure 9.2. In approximately what years did the U.S. economy experience its longest economic expansion?
(Multiple Choice)
5.0/5 (38)
Refer to the following figure when answering the following questions.
Figure 9.5: U.S. Inflation 1960-2015 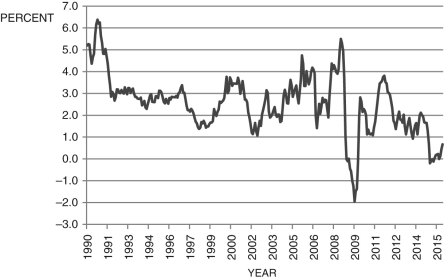 (Source: Bureau of Labor Statistics)
-Consider Figure 9.5, which shows the annual inflation rate. According to the Phillips curve, the period from about 1998 to 2000 was a period of:
(Source: Bureau of Labor Statistics)
-Consider Figure 9.5, which shows the annual inflation rate. According to the Phillips curve, the period from about 1998 to 2000 was a period of:
(Multiple Choice)
4.9/5 (35)
Figure 9.8: Cyclical Unemployment: 1980-2015 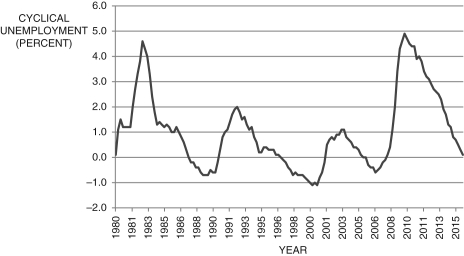 (Source: Federal Reserve Economic Data, St. Louis Federal Reserve)
-The figure above shows cyclical unemployment for the years 1980-2015. Using your best guess by looking at the figure, what was the output gap in 1992, 2003, 2010, and 2015? What is the change in inflation for those years?
(Source: Federal Reserve Economic Data, St. Louis Federal Reserve)
-The figure above shows cyclical unemployment for the years 1980-2015. Using your best guess by looking at the figure, what was the output gap in 1992, 2003, 2010, and 2015? What is the change in inflation for those years?
(Essay)
4.8/5 (44)
Refer to the following figure when answering the following questions.
Figure 9.2: U.S. Output Fluctuations 1960-2015
-Consider Figure 9.2. In approximately which of the following years was current output equal to potential output?
(Multiple Choice)
5.0/5 (39)
Filters
- Essay(0)
- Multiple Choice(0)
- Short Answer(0)
- True False(0)
- Matching(0)