Exam 4: A Model of Production
Exam 1: Introduction to Macroeconomics35 Questions
Exam 2: Measuring the Macroeconomy114 Questions
Exam 3: An Overview of Long-Run Economic Growth110 Questions
Exam 4: A Model of Production129 Questions
Exam 5: The Solow Growth Model126 Questions
Exam 6: Growth and Ideas120 Questions
Exam 7: The Labor Market, Wages, and Unemployment119 Questions
Exam 8: Inflation117 Questions
Exam 9: An Introduction to the Short Run113 Questions
Exam 10: The Great Recession: a First Look108 Questions
Exam 11: The Is Curve128 Questions
Exam 12: Monetary Policy and the Phillips Curve135 Questions
Exam 13: Stabilization Policy and the Asad Framework113 Questions
Exam 14: The Great Recession and the Short-Run Model112 Questions
Exam 15: Dsge Models: the Frontier of Business Cycle Research119 Questions
Exam 16: Consumption109 Questions
Exam 17: Investment116 Questions
Exam 18: The Government and the Macroeconomy122 Questions
Exam 19: International Trade107 Questions
Exam 20: Exchange Rates and International Finance142 Questions
Exam 21: Parting Thoughts35 Questions
Select questions type
Consider two countries, labeled 1 and 2. Each has the production function  , = 1, 2. If the only difference between the two countries is that A1 A2:
(Multiple Choice)
4.7/5  (37)
(37)
The marginal product of the labor curve represents the labor supply curve.
(True/False)
4.7/5 (41)
In the year 2014 the five richest countries had a per capita GDP ________ times higher than the five poorest countries. Differences in capital per worker explain about ________ percent of this difference, with total factor productivity making up about ________ percent of this difference.
(Multiple Choice)
4.7/5 (37)
One of the key characteristics of the Cobb-Douglas production function is:
(Multiple Choice)
4.8/5 (36)
Figure 4.5: Production Function 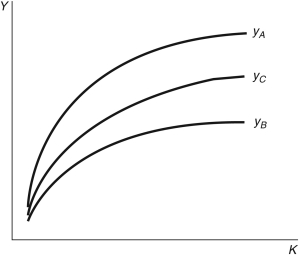 -Consider the three production functions in Figure 4.5. Each represents a different country. For any given per capita stock of physical capital, which country has the highest total factor productivity?
(Multiple Choice)
4.8/5 (29)
Suppose the total factor productivity in Switzerland, Italy, South Africa, and India is 0.89, 0.70, 0.33, and 0.21, respectively. If the U.S. total factor productivity is 1.00, then the United States is ________ productive, respectively, than these four countries.
(Multiple Choice)
4.8/5 (30)
In the Cobb-Douglas production function  , defining y = Y/L as output per person and
K=K/L as capital per person, the per person production function is:
, defining y = Y/L as output per person and
K=K/L as capital per person, the per person production function is:
(Multiple Choice)
4.7/5 (37)
Refer to the following figure when answering the following questions.
Figure 4.1: Production Function 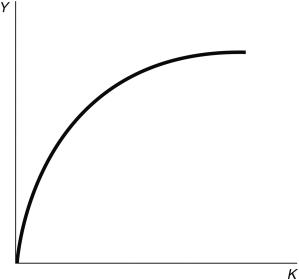 -Consider Figure 4.1. The shape of this production function suggests that in the production function
  is:
is:
(Multiple Choice)
4.9/5 (34)
The two main inputs we consider in a simple production function are:
(Multiple Choice)
4.8/5 (45)
If the U.S. total factor productivity is 1.00 and China's is 0.33, then the U.S. capital per worker is 67 percentage points more productive than China's.
(True/False)
4.9/5 (26)
If the production function is given by  and K = 27 and L = 8, total output equals:
(Multiple Choice)
4.8/5 (35)
In the Cobb-Douglas production function  , if a = 1/3, then:
(Multiple Choice)
4.9/5 (43)
The production function  describes how ________ can be combined to generate output.
(Multiple Choice)
4.9/5 (38)
Which of the following production functions exhibits constant returns to scale?
(Multiple Choice)
4.9/5 (36)
Filters
- Essay(0)
- Multiple Choice(0)
- Short Answer(0)
- True False(0)
- Matching(0)