Exam 4: A Model of Production
Exam 1: Introduction to Macroeconomics35 Questions
Exam 2: Measuring the Macroeconomy114 Questions
Exam 3: An Overview of Long-Run Economic Growth110 Questions
Exam 4: A Model of Production129 Questions
Exam 5: The Solow Growth Model126 Questions
Exam 6: Growth and Ideas120 Questions
Exam 7: The Labor Market, Wages, and Unemployment119 Questions
Exam 8: Inflation117 Questions
Exam 9: An Introduction to the Short Run113 Questions
Exam 10: The Great Recession: a First Look108 Questions
Exam 11: The Is Curve128 Questions
Exam 12: Monetary Policy and the Phillips Curve135 Questions
Exam 13: Stabilization Policy and the Asad Framework113 Questions
Exam 14: The Great Recession and the Short-Run Model112 Questions
Exam 15: Dsge Models: the Frontier of Business Cycle Research119 Questions
Exam 16: Consumption109 Questions
Exam 17: Investment116 Questions
Exam 18: The Government and the Macroeconomy122 Questions
Exam 19: International Trade107 Questions
Exam 20: Exchange Rates and International Finance142 Questions
Exam 21: Parting Thoughts35 Questions
Select questions type
One explanation of differences in total factor productivity is differences in labor's share of GDP.
(True/False)
4.9/5  (36)
(36)
If the production function is given by  and
and  And K = L = 8, total output equals:
(Multiple Choice)
4.9/5 (39)
As an economist working at the International Monetary Fund, you are given the following data for Burundi: predicted per capita GDP, relative to the United States, as given by  , is 0.10, and total factor productivity is 0.083. What is the observed per capita GDP, relative to the United States?
(Multiple Choice)
4.7/5 (39)
In the Cobb-Douglas production function  , defining y = Y/L as output per person and
K = K/L as capital per person, the per person production function is:
, defining y = Y/L as output per person and
K = K/L as capital per person, the per person production function is:
(Multiple Choice)
4.9/5 (41)
Refer to the following table when answering the following questions.
Table 4.1: Production Model's Prediction for Per Capita GDP (US = 1) 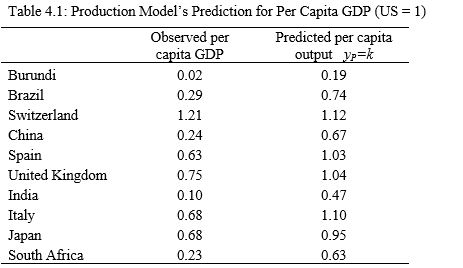 (Source: Penn World Tables 9.0)
-One explanation for the difference between the predicted output per person and the observed per capita GDP in Table 4.1 is differences in:
(Source: Penn World Tables 9.0)
-One explanation for the difference between the predicted output per person and the observed per capita GDP in Table 4.1 is differences in:
(Multiple Choice)
4.9/5 (34)
If the production function is given by  , then labor's share of GDP is one-third.
(True/False)
4.8/5 (42)
Suppose the payments to capital and labor are (w*L*)/Y* = 2/3 and (r*K*)/Y*= 1/3, respectively. One implication of this result is that ________ and profits are ________.
(Multiple Choice)
4.8/5 (40)
Refer to the following table when answering the following questions.
Table 4.1: Production Model's Prediction for Per Capita GDP (US = 1) (Source: Penn World Tables 9.0)
-Consider Table 4.1, which compares the model  to actual statistical data on per capita GDP. You observe the model:
(Multiple Choice)
4.8/5 (35)
A production function of the form  exhibits constant returns to scale.
(True/False)
4.8/5 (42)
In the Cobb-Douglas production function  , defining y = Y/L as output per person and
K = K/L as capital per person, the per person production function is:
, defining y = Y/L as output per person and
K = K/L as capital per person, the per person production function is:
(Multiple Choice)
4.8/5 (35)
A production function exhibits decreasing returns to scale when you:
(Multiple Choice)
5.0/5 (36)
In the production function 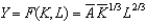 ,
,  represents a productivity parameter.
(True/False)
4.9/5 (44)
Refer to the following table when answering the following questions.
Table 4.1: Production Model's Prediction for Per Capita GDP (US = 1) (Source: Penn World Tables 9.0)
-One explanation for the difference between the predicted output per person and the observed per capita GDP in Table 4.1 is differences in:
(Multiple Choice)
5.0/5 (32)
Suppose the payments to capital and labor are (w*L*)/Y* = 2/3 and (r*K*)/Y*= 1/3, respectively. One implication of this result is:
(Multiple Choice)
4.8/5 (38)
Which of the following do(es) NOT explain differences in total factor productivity?
(Multiple Choice)
4.8/5 (37)
A production function exhibits increasing returns to scale when you:
(Multiple Choice)
4.8/5 (42)
Filters
- Essay(0)
- Multiple Choice(0)
- Short Answer(0)
- True False(0)
- Matching(0)