Exam 4: A Model of Production
Exam 1: Introduction to Macroeconomics35 Questions
Exam 2: Measuring the Macroeconomy114 Questions
Exam 3: An Overview of Long-Run Economic Growth110 Questions
Exam 4: A Model of Production129 Questions
Exam 5: The Solow Growth Model126 Questions
Exam 6: Growth and Ideas120 Questions
Exam 7: The Labor Market, Wages, and Unemployment119 Questions
Exam 8: Inflation117 Questions
Exam 9: An Introduction to the Short Run113 Questions
Exam 10: The Great Recession: a First Look108 Questions
Exam 11: The Is Curve128 Questions
Exam 12: Monetary Policy and the Phillips Curve135 Questions
Exam 13: Stabilization Policy and the Asad Framework113 Questions
Exam 14: The Great Recession and the Short-Run Model112 Questions
Exam 15: Dsge Models: the Frontier of Business Cycle Research119 Questions
Exam 16: Consumption109 Questions
Exam 17: Investment116 Questions
Exam 18: The Government and the Macroeconomy122 Questions
Exam 19: International Trade107 Questions
Exam 20: Exchange Rates and International Finance142 Questions
Exam 21: Parting Thoughts35 Questions
Select questions type
Figure 4.4: Labor Market 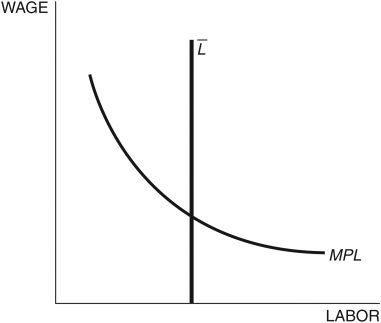 -In Figure 4.4, MPL represents the labor ________,
  represents the labor ________, and the intersection of the two yields the ________.
(Multiple Choice)
4.7/5  (34)
(34)
The production function  describes how ________ can be combined to generate output.
(Multiple Choice)
4.8/5 (34)
Convert the Cobb-Douglas production  into per capita terms. Why might we be more concerned about per capita output rather than total output when discussing the welfare impacts of economic growth?
(Essay)
4.8/5 (49)
A production function exhibits constant returns to scale when you:
(Multiple Choice)
4.9/5 (33)
The solution to the firm's maximization problem is how much:
(Multiple Choice)
4.8/5 (42)
As an economist working at the International Monetary Fund, you are given the following data for South Africa: predicted per capita GDP, relative to the United States, as given by  , is 0.55, and total factor productivity is 0.33. What is the observed per capita GDP, relative to the United States?
(Multiple Choice)
4.8/5 (34)
As an economist working at the International Monetary Fund, you are given the following data for Brazil: predicted per capita GDP, relative to the United States, as given by  , is 0.56, and total factor productivity is 0.36. What is the observed per capita GDP, relative to the United States?
(Multiple Choice)
5.0/5 (38)
The influences of institutions on economic performance can be easily contrasted using:
(Multiple Choice)
4.8/5 (39)
Differences in output across economies with the same per capita capital stock can be explained by:
(Multiple Choice)
5.0/5 (43)
You are an economist working for the International Monetary Fund. Your boss wants to know what the total factor productivity of India is, but all you have is data on per capita GDP, y, and the per capita capital stock, k. If you assume that capital's share of GDP is one-fourth, what would you use to find total factor productivity?
(Multiple Choice)
4.8/5 (37)
The two main inputs we consider in our production function model are labor and land.
(True/False)
4.8/5 (40)
Figure 4.6: Production Function 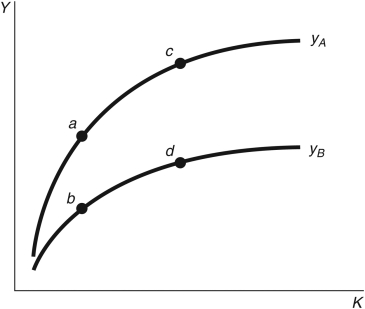 -Consider the two production functions in Figure 4.6, representing two countries. Which of the following is true?
i. At points a and b, each country has the same per capita capital stock but different factor
Productivity.
ii. Points a and c represent the same country but with different factor productivity.
iii. Points b and d represent the same country but with different stock of per capita capital.
-Consider the two production functions in Figure 4.6, representing two countries. Which of the following is true?
i. At points a and b, each country has the same per capita capital stock but different factor
Productivity.
ii. Points a and c represent the same country but with different factor productivity.
iii. Points b and d represent the same country but with different stock of per capita capital.
(Multiple Choice)
4.9/5 (34)
Consider two countries, A and B. If each country produces using identical production functions, but yA = yB and kA =kB, the total factor productivity of country A equals that of B.
(True/False)
4.8/5 (39)
In the Cobb-Douglas production function  , labor's share of GDP is:
(Multiple Choice)
4.9/5 (41)
In the equation 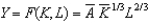 , the "bars" over the A and K mean they are:
(Multiple Choice)
4.9/5 (44)
Which of the following are we likely going to want to explain with an economic model?
i. Why people in the United States are 50 times richer than Ethiopians.
ii. What causes economic growth.
iii. What we think politicians should do with taxes.
(Multiple Choice)
4.8/5 (39)
Refer to the following table when answering the following questions.
Table 4.1: Production Model's Prediction for Per Capita GDP (US = 1) 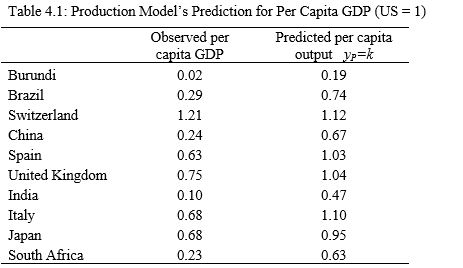 (Source: Penn World Tables 9.0)
-One explanation for the difference between the predicted output per person and the observed per capita GDP in Table 4.1 is differences in:
(Source: Penn World Tables 9.0)
-One explanation for the difference between the predicted output per person and the observed per capita GDP in Table 4.1 is differences in:
(Multiple Choice)
4.9/5 (39)
Filters
- Essay(0)
- Multiple Choice(0)
- Short Answer(0)
- True False(0)
- Matching(0)