Exam 3: Statistical Process Control
Exam 1: Introduction to Operations and Supply Chain Management74 Questions
Exam 2: Quality Management86 Questions
Exam 3: Statistical Process Control161 Questions
Exam 4: Product Design81 Questions
Exam 5: Service Design77 Questions
Exam 6: Processes and Technology48 Questions
Exam 7: Capacity and Facilities Design90 Questions
Exam 8: Human Resources85 Questions
Exam 9: Project Management98 Questions
Exam 10: Supply Chain Management Strategy and Design73 Questions
Exam 11: Global Supply Chain Procurement and Distribution96 Questions
Exam 12: Forecasting99 Questions
Exam 13: Inventory Management25 Questions
Exam 14: Sales and Operations Planning34 Questions
Exam 15: Resource Planning86 Questions
Exam 16: Lean Systems99 Questions
Exam 17: Operational Decision-Making Tools: Decision Analysis38 Questions
Exam 18: Operational Decision-Making Tools: Acceptance Sampling28 Questions
Exam 19: Operational Decision-Making Tools: Facility Location Models23 Questions
Exam 20: Operational Decision-Making Tools: Work Measurement29 Questions
Exam 21: Operational Decison-Making Tools: Transportation and Transshipment Models102 Questions
Exam 22: Operational Decision-Making Tools: Simulation84 Questions
Exam 23: Operational Decision-Making Tools: Linear Programming92 Questions
Select questions type
A pattern test can identify an out-of-control process even if all sample points are within control limits.
(True/False)
4.9/5  (41)
(41)
Variable (quantitative) control charts are used to monitor measurable characteristics of a process's outputs rather than descriptive characteristics.
(True/False)
4.8/5 (39)
Tolerances or specification limits are allowable variation prescribed in a product design.
(True/False)
4.9/5 (36)
Control charts are never implemented until special cause variation has been detected in a process.
(True/False)
4.9/5 (31)
Variable control charts are used for quantitative measures such as weight or time.
(True/False)
4.7/5 (49)
If a sample point plotted on a control chart is outside the control limits
(Multiple Choice)
4.9/5 (33)
Consider a service process that completes tax returns. An auditor has taken 20 samples each containing one completed tax return. Easy Tax is a service company that prepares tax returns. An outside auditor has examined 20 samples each containing one completed tax return. The total number of defects observed over the 20 samples is 200. The standard deviation for the control chart is
(Multiple Choice)
4.9/5 (45)
One advantage of using a pattern test is that special cause variations may be identified before any points are plotted outside the control limits.
(True/False)
4.8/5 (36)
Special cause variation can be identified using statistical process control.
(True/False)
4.8/5 (33)
Consider a production process that produces batteries. A quality engineer has taken 20 samples each containing 100 batterieslight bulbs. The total number of defective batteriesunits observed over the 20 samples is 1200. The sample standard deviation is
a. 0.0183
b. 0.0224
c. 0.0265
d. 0.05210
(Short Answer)
4.7/5 (38)
The goal of statistical process control is to ensure that the control limits and specifications limits for a process always remain the same.
(True/False)
4.8/5 (32)
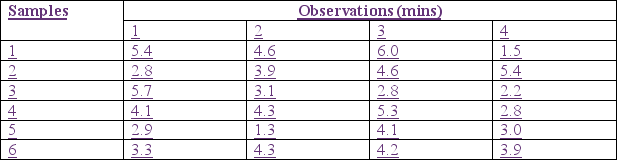
Dumplings -To-Go (DTG) provides take-out dumplings and noodle dishes to customers at its chain of drive-through restaurants. The target for a customer's waiting time is 3.0 minutes +/- 1 minute. Each month, one of the managers observes the drive-through process and collects a sample of 4 waiting times a day over a 6 day period. The data from one restaurant appears below. If DTG were to construct an X-bar chart from this data, the 3-sigma UCL would be Insert table here
(Multiple Choice)
4.8/5 (32)
If a pattern is evident in the points plotted on a control chart, the points are always considered evidence that the process is in control.
(True/False)
4.9/5 (42)
Process control charts are often used at a critical point after which it is difficult to correct or rework the process output.
(True/False)
4.7/5 (38)
Using Excel to construct control charts should be avoided because most people believe using software results in too many errors.
(True/False)
4.8/5 (33)
The range measures the variation within samples versus the variation between samples.
(True/False)
4.7/5 (43)
Marble Inc. makes countertops from a variety of high-end materials. To monitor the quality of its production processes the company randomly selects one countertop and counts the number of blemishes. The results for ten samples are shown below:  Given the sample information above, the average number of defects per unit for this process would be
(Multiple Choice)
4.8/5 (27)
105. A company produces a product which is designed to weigh 10 oz., with a tolerance of + 0.5 oz. The process produces products with an average weight of 9.95 oz. and a standard deviation of 0.10 oz. According to the process capability index
(Multiple Choice)
4.8/5 (35)
An x-bar and R-chart constructed to monitor and control a process use the same raw data.
(True/False)
4.9/5 (34)
Design specification limits should always be wider than the control limits for a given process.
(True/False)
4.8/5 (44)
Filters
- Essay(0)
- Multiple Choice(0)
- Short Answer(0)
- True False(0)
- Matching(0)