Exam 3: Statistical Process Control
Exam 1: Introduction to Operations and Supply Chain Management74 Questions
Exam 2: Quality Management86 Questions
Exam 3: Statistical Process Control161 Questions
Exam 4: Product Design81 Questions
Exam 5: Service Design77 Questions
Exam 6: Processes and Technology48 Questions
Exam 7: Capacity and Facilities Design90 Questions
Exam 8: Human Resources85 Questions
Exam 9: Project Management98 Questions
Exam 10: Supply Chain Management Strategy and Design73 Questions
Exam 11: Global Supply Chain Procurement and Distribution96 Questions
Exam 12: Forecasting99 Questions
Exam 13: Inventory Management25 Questions
Exam 14: Sales and Operations Planning34 Questions
Exam 15: Resource Planning86 Questions
Exam 16: Lean Systems99 Questions
Exam 17: Operational Decision-Making Tools: Decision Analysis38 Questions
Exam 18: Operational Decision-Making Tools: Acceptance Sampling28 Questions
Exam 19: Operational Decision-Making Tools: Facility Location Models23 Questions
Exam 20: Operational Decision-Making Tools: Work Measurement29 Questions
Exam 21: Operational Decison-Making Tools: Transportation and Transshipment Models102 Questions
Exam 22: Operational Decision-Making Tools: Simulation84 Questions
Exam 23: Operational Decision-Making Tools: Linear Programming92 Questions
Select questions type
Consider a service process such as a fast food drive through window. The target for a customer's waiting time is 3.0 minutes. A manager observes the process and randomly collects a sample of four waiting times each hour over a 12 hour period. The sum of the average waiting time for each of the 12 samples is 35.4. The sum of the range for each of the 12 samples is 18.0. The UCL for the process control chart reporting variability between the sample means is
(Multiple Choice)
4.8/5  (43)
(43)
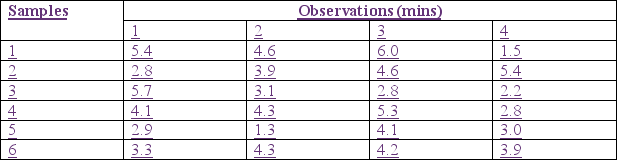
Dumplings -To-Go (DTG) provides take-out dumplings and noodle dishes to customers at its chain of drive-through restaurants. The target for a customer's waiting time is 3.0 minutes +/- 1 minute. Each month, one of the managers observes the drive-through process and collects a sample of 4 waiting times a day over a 6 day period. The data from one restaurant appears below. If DTG were to construct an R-chart from this data, the centerline would be INSERT TABLE HERE

(Multiple Choice)
4.8/5 (37)
Pizazz manufactures a 5.0 oz. energy drink of the same name. Because the cans are so small, consumers are concerned that they are not receiving the full 5 ounces in each can. A quality engineer at the company is charged with analyzing the filling process and ensuring accurate readings. On 15 different occasions over the past month, she has taken a sample of 6 energy drinks off the production line and recorded their weight. If the sum of the sample means is 80.20 ounces and the sum of the sample ranges is 12.68 ounces, the centerline for an X-bar chart of this process would be
(Short Answer)
4.7/5 (36)
If the points plotted on a control chart display a pattern, it is called a run.
(True/False)
4.7/5 (36)
Control charts visually show when a process is not within statistical control limits.
(True/False)
4.8/5 (49)
When a control chart is first developed, if the process is found to be out of control,
(Multiple Choice)
4.9/5 (38)
The process capability index indicates how much a process mean differs from the target specification value.
(True/False)
4.8/5 (44)
Some companies that strive to provide extremely high quality use Z=6 (six sigma) vs. Z=3 (three sigma) when constructing control limits.
(True/False)
5.0/5 (41)
With a c-chart, the sample size is small and often may only contains only one item.
(True/False)
4.8/5 (35)
Common cause (random) variation provides evidence that the process is not in control.
(True/False)
4.8/5 (37)
The R-chart is used for monitoring and controlling variation within samples.
(True/False)
4.8/5 (29)
The process capability ratio measures the nonrandom variation (6 sigma) specification limits over the specification limitscontrol limits.
(True/False)
4.9/5 (34)
One goal of statistical process control is to prevent a process from producing items that have to be scrapped or reworked.
(True/False)
4.8/5 (40)
Dumplings -To-Go (DTG) provides take-out dumplings and noodle dishes to customers at its chain of drive-through restaurants. The target for a customer's waiting time is 3.0 minutes +/- 1 minute. Each month, one of the managers observes the drive-through process and collects a sample of 4 waiting times a day over a 6 day period. The data from one restaurant appears below. If DTG were to construct an X-bar chart from this data, the 3-sigma LCL would be Insert table here
(Multiple Choice)
4.8/5 (41)
102. A company produces a product which is designed to weigh 10 oz., with a tolerance of + 0.5 oz. The process produces products with an average weight of 9.95 oz. and a standard deviation of 0.10 oz. The process capability ratio for this process is with z = 3.
(Multiple Choice)
4.9/5 (33)
A sequence of sample points that display a pattern is known as a run.
(True/False)
4.8/5 (37)
The formula used to determine the upper and lower control limits are based on product specification limits.
(True/False)
4.7/5 (41)
A process that is determined to be in control contains no variation.
(True/False)
4.8/5 (39)
99. In general, a process is considered to be in control for all the following conditions except
(Multiple Choice)
4.9/5 (34)
Consider a production process that produces batteries. A quality engineer has taken 20 samples each containing 100 batterieslight bulbs. The total number of defective batteriesunits observed over the 20 samples is 1200. The UCL for the control chart constructed using two sigma is
a. 0..088
b. 0.094
c. 0.104
d. 0.11660
(Short Answer)
4.9/5 (36)
Filters
- Essay(0)
- Multiple Choice(0)
- Short Answer(0)
- True False(0)
- Matching(0)